| Issue |
Int. J. Lim.
Volume 60, 2024
Special Issue - Advances in freshwater ecology in Sub-Saharan Africa
|
|
|---|---|---|
| Article Number | 7 | |
| Number of page(s) | 11 | |
| DOI | https://doi.org/10.1051/limn/2024006 | |
| Published online | 26 June 2024 | |
Research article
Responses of the macroinvertebrate community to urban wastewater pollution in the upper Ouémé Basin in Benin
1
Université de Parakou (UP), Faculté d’Agronomie (FA), Laboratoire d’Ecologie, de Santé et de Productions Animales (LESPA), BP 123 Parakou, Benin
2
Université de Rennes, CNRS, ECOBIO – UMR 6553, 35000, Rennes, France
* Corresponding author: This email address is being protected from spambots. You need JavaScript enabled to view it.
Received:
30
September
2022
Accepted:
15
May
2024
Abstract
In Benin, most of urban wastewaters are discharged into rivers without any prior treatment. The objective of this study was to assess the effects of urban wastewater on the macroinvertebrate communities of the upper Ouémé River in Benin. To address this question, 30 stations located on five rivers were monitored in the dry and the wet seasons. For each station and each season, 12 samples of macroinvertebrates following standardized French multi-habitat sampling protocol were collected and physico-chemical parameters were recorded. Three types of stations were chosen on each river: two control stations located upstream of the wastewater discharge points, two stations impacted in the urban area and receiving urban wastewaters, and two stations downstream of the wastewater discharge points to measure the resilience of a set of river characteristics. Urban wastewater impacted the water quality by mainly increasing electrical conductivity and the nutrient concentrations. Wastewaters also deeply impacted the diversity and the composition of the invertebrate community. The Indval index highlighted three indicator taxa for the control stations (Caenidae, Baetidae and Ephemerellidae), one for the impacted stations (Chironomidae), and two for the downstream stations (Libellulidae and Lestidae). We also observed ecosystem resilience a few hundred meters downstream of the discharge points. These results challenge managers on the degradation of river water quality in the upper Ouémé River, but also reveal good self-purification capacities of the watercourses likely to promote the resilience of these ecosystems.
Key words: Tropical river / wastewater / nutrient enrichment / community composition / environmental monitoring
© K.S. Abahi et al., Published by EDP Sciences, 2024
 This is an Open Access article distributed under the terms of the Creative Commons Attribution License (https://creativecommons.org/licenses/by/4.0), which permits unrestricted use, distribution, and reproduction in any medium, provided the original work is properly cited.
1 Introduction
The pollution of aquatic ecosystems by the dumping off of waste is increasing worldwide because the human population, industrialization and urbanization are soaring (Cooper, 1993; Grimm et al., 2008), hence new liquid waste management issues (Owa, 2013; Edokpayi et al., 2017). Different types of waste are discharged into rivers without being treated; they cause numerous disturbances of aquatic ecosystems and ecotoxicological hazards (Paul and Meyer, 2001; McKinney, 2002; Owa, 2013). Industrial waste, household waste, agricultural waste, excrement and various organic waste products degrade river water quality (Moss, 2008; Wang et al., 2014). These different pollutants have huge consequences on the environment, the life of aquatic ecosystems, human health (Dudgeon et al., 2006; Schwarzenbach et al., 2010), and the ecosystem values of water (Walmsley, 2002). Under these conditions, it seemed to us judicious to study the state of health of rivers for their preservation, their sustainable management, and the conservation of their biodiversity and ecosystem values.
This is particularly true in Africa where land use has intensified in many countries in recent years as a result of expanding farming and urbanization processes (Masters et al., 2013; Christiaensen, 2017). Urbanization generally occurs very close to the main rivers and streams, which are deeply impacted by rising wastewater loads, overcrowding, and settlements (Paul and Meyer, 2001; Chadwick et al., 2006; Grimm et al., 2008). It is generally uncontrolled, and wastewater management remains very scarce due to the lack of appropriate infrastructures, the lack of expertise and insufficient funding of wastewater treatment (Wang et al., 2014; Edokpayi et al., 2017). Owing to those constraints, wastewaters are often discharged into rivers, resulting in pollution that damages the aquatic community, causes biocenotic disturbances, poisoning and even the extinction of certain species (Owa, 2013; Edokpayi et al., 2017). Despite this urgent concern, studies dealing about African rivers remain very scarce in Tropical Africa and the expected responses of invertebrate communities are largely depending on knowledges collected in other part of the world (Kaboré et al., 2022) and were rarely supported by studies in African rivers. For instance, responses of African EPT to rising temperature is not the same in Cameroon than in developed countries (Chinche et al., 2023). One of the consequences of this situation is that responses of African macroinvertebrates to wastewater remains largely unknown.
To fill this gap, we assessed the effect of urban wastewaters on the macroinvertebrate community of the upper Ouémé Basin in Benin. The Ouémé River − the largest river in Benin and an important water resource for human activities − is under the influence of domestic effluents (wastewater, laundry, machine washing and dish washing), agricultural (pesticides and fertilisers) and industrial (wastewater from sugar and spirit manufacturing plants) (Atinkpahoun et al., 2020). In the last decade, a greater concentration of people has been observed along the watersheds of the Upper Ouémé River, displaced by the arid climate and unemployment outside cities (1,364,353 inhabitants; INSAE, 2022). Thus, ecosystems are being altered not only along the main river but also along its tributaries.
Based on previous studies in developed countries (Paul and Meyer, 2001; Dodds and Smith, 2016) and in tropical rivers in South America (Tromboni and Dodds, 2017; Cerqueira et al., 2020), we predicted firstly a significant increase of nutrient concentrations in urban areas. Secondly, we expected a modification of the macroinvertebrate community, i.e., decreased biodiversity (Peralta et al., 2020), an altered composition (Sterling et al., 2016) and ecosystem functioning (Yule et al., 2015). However, we expected macroinvertebrate communities to respond less strongly in Africa, given that the percentage of sensitive species (i.e. EPT) is lower in this part of the world. Thirdly, gradually reduced impacts of urbanization downstream of the wastewater inputs due to the self-purification ability of rivers and according to the distance from the wastewater input, and finally a higher impact of wastewaters during the dry season (Onwona Kwakye et al., 2021) as a result of reduced water volume and more concentrated pollutants.
2 Materials and methods
2.1 Study area and sampling stations
The study was carried out in the Ouémé Basin − the largest river basin in Benin. The Ouémé River is located between 10°1’ N and 6°30’ N. It rises in the Tanéka Mountains in the north of the country in the department of Donga and flows to the south where it feeds the lagoon system of Lake Nokoué and the lagoon of Porto-Novo. Its basin occupies an area of 50,000 km2 and its main course is 510 km long. It is divided into two parts: the Upper Ouémé and the Lower Ouémé. The upper reaches of the Ouémé River, to which our study relates, are bounded by the hydrometric station of the Savè Bridge to the south, by the Pendjari Basin and the Atacora Chain to the northwest, and by the Niger Basin in the northeast. They are exposed to the dry Sudanian climate located between latitudes 9° and 12° N, where rainfall varies from 900 to 1100 mm ∙ yr−1, and to the Sudano-Guinean climate located between 8° and 9° N, where rainfall varies from 1000 to 1200 mm ∙ yr−1. The population density in this part of Benin has increased from 33 inhabitants per km2 in 2002 to 61 inhabitants per km2 in 2022. However, the inhabitants of the Upper Ouémé are concentrated along the main tributaries of the Ouémé River in cities ranging from 16,096 to 267,812 inhabitants (Parakou, the largest city in the north of the country) (INSAE, 2022).
We selected five rivers in the study area (Affon, Donga, Okpara, Ouémé and Klou) according to the presence of cities along the watershed and the presence of natural areas upstream (Fig. 1). For each river, six stations were considered (Tab. 1): two control stations located 100 to 1200 m upstream of urban discharges, two stations at the main wastewater discharge point, and two stations 50–300 m downstream of urban inputs.
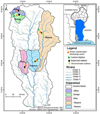 |
Fig. 1 Map of the Ouémé Basin showing the urban wastewater discharge points and the sampling locations. |
Description of the sampling stations.
2.2 Abiotic typology of the sampling stations in response to wastewater inputs
The following physical and chemical variables were measured at each sampling station directly in the field between 8 a.m. and 12 p.m. in the dry season (February) and in the rainy season (June): water temperature, total dissolved solids (TDS) and electrical conductivity were measured using a portable multi-parameter (HANNA, HI 99300); pH was measured with a pHmeter (HANNA, HI 98107), and water depth with a graduated ruler. Additional water samples were collected for other analyses at each station, using sterile bottles. These bottles were labelled and stored at 4 °C in a cooler containing ice, and transported to the Laboratory of Ecology, Health and Animal Production (LESPA) of the University of Parakou the same day. In the laboratory, the water samples were used the following day to measure the biological oxygen demand (BOD5), the chemical oxygen demand (COD), nitrites (NO2–), orthophosphates (PO43–) and ammonium (NH4+) concentrations according to adapted methods (APHA, 2005).
2.3 Macroinvertebrate sampling
Macroinvertebrates were collected using a Surber net sampler (0.05 m2 and 500 µm mesh size). Samples were collected using the standardized French multi-habitat sampling protocol (Multi-Habitat Sampling, norm XP T 90-333) (AFNOR, 2009): 12 samples per site and per season (one sampling period in the dry and wet seasons) were collected according to the relative coverage and fauna-hosting capacity of the substrates. The samples were preserved in 90° ethanol in labelled bottles and transported to the laboratory. In the laboratory, macroinvertebrates were sorted, counted and identified using an Olympus SZX10 stereomicroscope down to the family level except the phylum Nemathelminths, the class Oligochaeta and the order Hydracarina, using several keys (McCafferty, 1983; Durand and Lévêque, 1981; Moisan, 2010; Tachet et al., 2010).
2.4 Data analysis
Biological metrics − including taxon richness and the Shannon diversity index − were calculated to describe macroinvertebrate communities. Other indices such as % Ephemeroptera, Plecoptera and Tricoptera (% EPT), % Chironomidae, % Diptera and the EPT/Chironomidae ratio were applied to determine biological integrity at each station. A principal component analysis (PCA) was performed to provide a typology of stations based on the water quality. A mixed model ANOVA with “location” and “season” as fixed factors and a “river” factor nested in “location” was run to test the variability of the indices across seasons and locations, and Tukey’s HSD test was used for pairwise comparisons. The analyses (PCA and ANOVAs) were carried out using Statistica 7 software (StatSoft).
Indicator species analysis was used to identify indicator taxa representing each station (Dufrêne and Legendre, 1997). This analysis calculates an indicator value (IndVal) for each taxon in each group based on its relative abundance and relative frequency in the samples. IndVal values range from 0 (“no indication” status) to 100 (“perfect indication” status) (Petersen and Keister, 2003). P-values indicate the significance of indication for each taxon. IndVal was run using the function Indval in R software version 4.1.2 (R Core Team, 2022) using the package labdsv (Roberts, 2016).
3 Results
3.1 Abiotic typology of the sampling stations in response to wastewater inputs
The PCA results are depicted in Figure 2. PCA axis 1 and axis 2 explained 44.9% and 19.4% of the variance of the physicochemical variables, respectively. PC1 was mainly explained by COD (17.1%), electrical conductivity (16.2%), ammonium (14.9%) and nitrite (12.3%) concentrations, and BOD5 (13.7%). PC2 was mainly supported by the water depth (41.3%) and water transparency (40.3%) (Fig. 2a). The impacted stations were strongly correlated with PC1, and characterized by high values of ammonium, conductivity, BOD5, COD, and nitrites (Fig. 2b). The stations located downstream were characterized by relatively high values of depth and transparency (Fig. 2b). Finally, the control stations were characterized by lower values of all parameters than the other stations (Fig. 2b). Finally, the seasonal effect was depicted by PC1: most parameters increased during the dry season, except water depth that increased during the wet season (Fig. 2c, Tab. 2).
All physicochemical variables, except for pH, differed significantly between the control and the impacted stations (Tab. 3) and differences decreased significantly in downstream stations (Tab. 3).
Mean values ± SD of the physical and chemical parameters according to locations and seasons (Cond.: electrical conductivity; Transp.: Transparency; Temp.: Temperature).
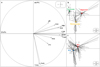 |
Fig 2 Results of the principal component analysis (PCA) of the environmental parameters of 30 stations. (a) Correlation circle showing correlations among the 11 environmental parameters (Cond. electrical conductivity; Transp. transparency). (b) Distribution of the barycentres of each location (coloured circles); solid lines link the station to each location and each season to the corresponding location. (c) Distribution of the barycentres of each season; solid lines link the station at each location to the corresponding season. |
Mean values ± SD of the physical and chemical parameters according to locations and seasons. Letters results of Wilcoxon and Kruskal-Wallis tests on “season” and “location”, respectively.
3.2 Responses of macroinvertebrate communities to wasterwater effluents
Thirty-one thousand, two hundred and one (31,201) macroinvertebrates were counted, and 62 taxa were identified (Tab. 4). Macroinvertebrates included five phyla: Arthropods (86.4%), Annelids (8.2%), Molluscs (4.2%), Nemathelminths (1%) and Plathelminths (0.2%). The class of Insects was most abundant (86.3% of the total number) and most diversified, with 7 orders and 48 families.
Total and relative (RA) abundances of macroinvertebrates at each station.
3.3 Responses of diversity indices
Taxonomic richness (Fig. 3a) varied significantly along rivers (F8,702 = 4.15; P < 0.0001), locations (F2,702 = 25.92; P < 0.0001) and seasons (F1,702 = 78.15; P < 0.0001). The taxonomic richness was lowest at Affon and Okpara rivers, while the Donga and Oueme rivers were the richest rivers and Klou River intermediate. Moreover, the taxonomic richness of the impacted stations (13.4 ± 3.9) was significantly lower than that of the control stations (21.2 ± 5.2) and intermediate in the downstream stations (15.7 ± 3.9; P < 0.0001). Significant interactions among factors (Fig. 3a; F2,702 = 8.08; P = 0.0003) indicated that the effect of wastewater was stronger during the wet season than during the dry one. The percentage of richness recovered between the impacted station and the downstream station ranged between 5% in the Klou River to 25.6% in the Donga River. However, the recovery was not correlated neither to the distance between the two stations (spearman correlation P = 0.105) nor with the diversity of the river in the control or impacted stations (P = 0.747 and P = 0.624, respectively).
The Shannon diversity index (Fig. 3b) had a similar pattern to that of taxonomic richness and varied significantly along rivers (F8,702 = 2.36; P = 0.016) and locations (F2,702 = 128; P < 0.0001). However, there was no significant effect of “season” (F1,702 = 3.437; P = 0.064) or of the “season” × “location” interaction (F2,702 = 1.7; P = 0.183). As for taxonomic richness, the values of the Shannon index were lowest at Affon and Okapara rivers.
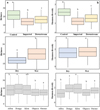 |
Fig. 3 Mean values ± SE of taxonomic richness (a) and the Shannon diversity index (b) according to “location”. “season” and “river”. Letters indicate significant differences from pairwise Tukey’s HSD tests. |
3.4 Macroinvertebrate metrics used to assess biological integrity
Three families had significant indicator values for the control upstream stations: the Ephemeroptera Caenidae (IndVal = 0.84; P = 0.001), Baetidae (IndVal = 0.63; P = 0.001), and Ephemerellidae (IndVal = 0.54; P = 0.001). In the impacted stations, only the Chironomidae family (Diptera) (IndVal = 0.52; P = 0.001) was considered as an indicator taxon. The Odonata families Libellulidae (IndVal = 0.53; P = 0.005) and Lestidae (IndVal = 0.53; P = 0.004) were the best indicators taxa in the downstream stations.
The percentage of EPT (Fig. 4) and the EPT/Chironomidae ratio were higher in the control stations, upstream of the wastewater inputs (F2,702 = 174; P < 0.001 and F2,702 = 102; P < 0.001, respectively). On the contrary, the percentages of Diptera (Fig. 4) and Chironomidae (Fig. 4) were higher in the impacted and downstream stations (F2,702 = 146; P < 0.001 and F2,702 = 119; P < 0.001, respectively), but significantly decreased in the downstream stations compared to the impacted stations (P-values < 0.0001). The %EPT tended to increase downstream (P = 0.062), but the EPT/Chironomidae ratio was similar in the impacted and the downstream stations (P = 0.32). Finally, the “season” effect was only significant for the EPT/Chironomidae ratio (F2,702 = 27.9; P < 0.001 and %Diptera (F2,702 = 20.7; P < 0.001), but remained similar for %EPT and %Chironomidae (F2,702 = 3.0; P = 0.084 and F2,702 = 0.01; P = 0.938, respectively).
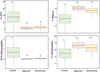 |
Fig. 4 Mean values ± SE of biological integrity assessment metrics. Letters indicate significant differences from pairwise Tukey’s HSD tests. |
4 Discussion
4.1 Effects of urban wastewaters on water physicochemical parameters
The study of the physicochemical quality of the water of the Ouémé Basin showed that the parameters varied according to the season and the location. The highest values of most parameters (ammonium, conductivity, BOD5, COD, nitrite, pH, orthophosphates, TDS and temperature) were recorded during the dry season. The lower values recorded during the wet season can be explained by the dilution effect of rainfall, confirmed by the increased water depth during the wet season. Another possible explanation may be the leaching effect of rains during the wet season, which can explain the low transparency recorded in the wet season (Onwona Kwakye et al., 2021). However, the leaching of larger particles such as organic matter, dissolved solids, leaching of soil contaminant and point source water pollution discharged from industrial or wastewater treatment facilities at the beginning of the rainy season can also clean up the urban environment and reduce the amount of pollutants to be transported later in the rainy season and also contribute to the decrease of organic pollutant in this season. Most parameters had the highest values at the impacted stations located near the wastewater inputs. The high values of electrical conductivity, TDS, pH, nutrients, COD, and BOD5 recorded at the impacted stations are indicators of gross pollution and of the organic loads that characterized those stations. Other studies with similar site conditions yielded similar results (Tchakonté et al., 2015; Arimoro et al., 2015; Ngoay-Kossy et al., 2018; Peralta et al., 2020). These high values reflect strong anthropization linked to urban wastewaters directly discharged into the river, especially during the dry season when they are less diluted. The BOD5 (ranged from 58 to 110 mg L−1) and ammonium concentrations (until 9.7 mg L−1) measured at the impacted stations were far above the acceptable limit (5 and 3 mg L−1, respectively) for drinking water according to the World Health Organization (WHO, 2017), confirming the existence of organic pollution even on our control stations. Our values are also well above those previously recorded in polluted rivers in West Africa (18.7 and 1.45 mg L−1 in Onwona Kwakye et al., 2021; 1.65 and 1.45 mg L−1 in Keke et al., 2021; 20 mg L−1 for BOD in Tampo et al., 2021) and confirm a strong impact of urban water on river ecosystem in the Oueme Basin.
The intermediate values of the physicochemical parameters and the greater water transparency observed at the downstream stations indicate either a dilution/sedimentation of pollutants but might also indicate some self-purifying capacity of the rivers because the nutrient concentrations in the water have different profiles between the impacted stations and the stations downstream. For example, the phosphorus concentration is halved, while the nitrate content is divided by 13. Water temperature was also impacted by human activities: it varied along all the rivers studied. The increase in temperature from the control stations to the downstream stations may be attributed to intense human activities lightening the canopy stations by exposing them to strong insolation (Webb and Zhang, 2004; Ngoay-Kossy et al., 2018).
4.2 Responses of the macroinvertebrate community to wastewater inputs
Eight classes of macroinvertebrates were identified, among which Insects, Oligochaeta and Gastropods were predominant. This dominance is in agreement with previous studies on macroinvertebrates in Benin (Koudenoukpo et al., 2017; Chikou et al., 2018; Abahi et al., 2020), the Central African Republic (Ngoay-Kossy et al., 2018), Ivory Coast (Camara et al., 2014), and Nigeria (Arimoro, 2009). The macroinvertebrate community of the Ouémé Basin was dominated by Diptera. They were present at all stations, and more so at the impacted stations, while EPT were only abundant at the control stations free of urban wastewater pollution. Similar works carried out in Burkina-Faso (Kaboré et al., 2015; 2022), Ghana (Onwona Kwakye et al., 2021); Nigeria (Arimoro et al., 2015; Ibezute et al., 2016; Keke et al., 2021) and Togo (Tampo et al., 2021) indicated a decline of EPT diversity and better adaptation of Diptera to pollution. Chironomidae, Ceratopogonidae and Simuliidae were very abundant at the impacted and downstream stations, and so were Oligochaeta. These results are typical of anthropised rivers in Africa whose main sources of pollution are domestic and industrial wastewaters (Arimoro et al., 2015; Camara et al., 2014; Ibezute et al., 2016; Ngoay-Kossy et al., 2018; Tampo et al., 2021; Keke et al., 2021). The preponderance of these pollution-tolerant taxa indicates a significant input of organic matter resulting from the discharge of wastewaters from households, slaughterhouses, vehicle wash centres and industrial units into rivers (Camara et al., 2014; Arimoro et al., 2015; Ibezute et al., 2016).
4.3 Responses of diversity indices to wastewater inputs
Sixty-two taxa of macroinvertebrates were identified in the study, with mean values of 21, 16 and 13 taxa at the control, downstream and impacted stations, respectively. Macroinvertebrate diversity decreased in the stations impacted by wastewater. The low taxonomic richness at the impacted stations was a consequence of the profound degradation of their ecological state. The decrease partially confirmed our second prediction, and had already been reported in Nigerian (Arimoro et al., 2015; Ibezute et al., 2016) and Zimbabwean (Mwedzi et al., 2020) urban areas. However, contrary the second part of our expectation, we also validated a strong responses for sensitive taxa such as EPT which strongly decreased in the impacted and downstream stations. This result confirms that EPT are sensitive to pollution in the same way in Africa as in other parts of the world (Barbour et al., 1999; Bode et al., 2002; Moisan et al., 2013).
Interestingly, macroinvertebrate diversity was significantly higher in the downstream stations than in impacted stations, suggesting resilient communities. However, resilience varied strongly among rivers, but, contrary to our third prediction, it did not vary significantly with the distance between the impacted and downstream stations: the resilience ability was one of the highest in the Affon River (24.5% of taxa lost in impacted station and recovered in the downstream station) although the distance between the impacted and downstream stations was the shortest (95 m). Moreover, the resilience of the Klou River was the lowest (only 5% of taxa recovered) whereas the distance between the impacted and downstream stations was the greatest (381 m). These results suggest that local factors (discharge, community composition, type of wastewater) are crucial for the resilience of the macroinvertebrate communities, or that maybe additional sources of pollution between the impacted and the downstream stations remained unidentified in some rivers.
Despite higher pollutant concentrations during the dry season due to a reduced water volume, the impact of wastewaters on macroinvertebrates was greater during the wet season. Several reasons can explain such a pattern. First, the concentrations of pollutants during the wet season are lower than in dry season but high enough to alter biological communities (e.g. the values of DBO5 were very high in wet and dry seasons, even in control stations). Moreover, the concentrations measured at the downstream stations remained above those of polluted sites in other studies (Arimoro et al., 2015; Tchakonté et al., 2015; Ibezute et al., 2016). Secondly, the increased runoff and discharge during the wet season may also increase the washing off of domestic (e.g. detergent) and industrial (e.g. PCBs, PAHs, heavy metals) pollutants not measured in this study but likely produced in urban environments (Tchakonté et al., 2015). Thirdly, the greater macroinvertebrate diversity during the wet season probably increased the number of sensitive species, whereas pollution-tolerant taxa are generally present round the year, even if the %EPT remained similar across seasons.
5 Conclusion
This study reveals that the stations polluted by urban wastewaters are physically, chemically and biologically degraded. The discharge of urban wastewaters into the rivers of the upper Ouémé basin has degraded the water quality to a point that it does not meet the requirements of the World Health Organization. This result is important because water from rivers is used by local people without prior treatment for different purposes, including drinking water. The degradation of the water quality decreases taxonomic richness: pollution-tolerant taxa thrive, while sensitive taxa are scarce. The alteration of the water quality was more visible during the dry season because pollutants were more concentrated in reduced water volumes, but the impact on the biological community seemed stronger during the wet season. Finally, we observed a good, highly variable self-purification capacity in most rivers depending on local factors (e.g. type of pollutant, discharge) rather than on the distance from the wastewater input. Our study highlights that wastewater management is crucial in Africa to improve the health of local populations. It also argues in favour of the development of adapted biomonitoring indexes of water quality to improve the management of African rivers. Based on the results of this study, managers and municipal officials are expected to apply management measures that will improve the quality of aquatic ecosystems, such as raising public awareness about the risks of direct wastewater discharge into rivers, a formal ban on the discharge of untreated wastewaters into rivers, and the construction of operational and efficient wastewater treatment plants in cities. The government is also expected to have the pollution legislation applied in the country. Other similar studies on other rivers in the country addressing each category of pollution source would reinforce the results of this study.
References
- Abahi KS, Gouissi FM, Akodogbo HH, Sanni Worogo SH, Adje DD, Gnohossou MP. 2020. Assessment of the water quality of the upper reaches of the Ouémé River in Bénin using benthic macroinvertebrate-based biotic indices. Rev Sci Eau 32: 433–444. [Google Scholar]
- AFNOR. 2009. Qualité de l’eau. Prélèvement des macroinvertébrés aquatiques en rivières peu profondes. Norme XP T 90–333. AFNOR, 1–15. [Google Scholar]
- APHA. 2005. Standard Methods for the Examination of Water and Wastewater, 19th ed. American Public Health Association, Washington, DC, USA. [Google Scholar]
- Arimoro FO. 2009. Impact of rubber effluent discharges on the water quality and macroinvertebrate community assemblages in a forest stream in the Niger Delta. Chemosphere 77: 440–449. [CrossRef] [PubMed] [Google Scholar]
- Arimoro FO, Odume ON, Uhunoma SI, Edegbene AO. 2015. Anthropogenic impact on water chemistry and benthic macroinvertebrate associated changes in a southern Nigeria stream. Environ Monit Assess 187: 1–14. [CrossRef] [PubMed] [Google Scholar]
- Atinkpahoun CNH, Pons M-N, Louis P, Leclerc J-P, Soclo HH. 2020. Rare earth elements (REE) in the urban wastewater of Cotonou (Benin, West Africa). Chemosphere 252: 440–449. [Google Scholar]
- Barbour MT, Gerritsen J, Snyder BD, Stribling JB. 1999. Rapid bioassessment protocols for use in streams and wadeable rivers: periphyton, benthic macroinvertebrates and fish. US Environmental Protection Agency, Office of Water Washington,DC. 220 p. [Google Scholar]
- Bode RW, Nova MA, Abele LE, Heitzman DL, Smith AJ. 2002. Quality assurance work plan for biological stream monitoring in New York State, Albany. Stream biomonitoring unit bureau of water assessment and management division of water, NYS Department of Environmental Conservation, 41 p. [Google Scholar]
- Camara AI, Diomande D, Gourene G. 2014. Impact des eaux usées et de ruissellement sur la biodiversité des macroinvertébrés de la rivière Banco (Parc National du Banco; Côte d’Ivoire). RAMRes SVTA 2: 58–68. [Google Scholar]
- Cerqueira TC, Mendonça RL, Gomes RL, Mota de Jesus R, da Silva DML. 2020. Effects of urbanization on water quality in a watershed in northeastern Brazil. Environ Monit Assess 192: 1–17. [CrossRef] [Google Scholar]
- Chadwick MA, Obberfuhl DRD, Benke AC, Huryn AD, Suberkropp K, Thiele JE. 2006. Urbanization affects stream ecosystem function by altering hydrology, chemistry, and biotic richness. Ecol Appl 16: 1796–1807. [CrossRef] [PubMed] [Google Scholar]
- Chikou A, Agblonon Houelome TM, Adandedjan D, Imorou Toko I, Karim IYA, Laleye AP. 2018. Structural organization of the macroinvertebrates communities of the Alibori River during the rainy season (Northern Benin). Int J Fish Aquat Stud 6: 285–291. [Google Scholar]
- Chinche SB, Piscart C, Mbanga Medjo P, Koji E, Tuekam Kayo RP, Zebaze Togouet SH. 2023. Impact of altitude on spring macroinvertebrates and water quality in South West region of Cameroon. Int J Limnol 59: 10. [CrossRef] [EDP Sciences] [Google Scholar]
- Christiaensen L. 2017. Agriculture in Africa − Telling myths from facts: A synthesis. Food Policy 67: 1–11. [CrossRef] [PubMed] [Google Scholar]
- Cooper CM. 1993. Biological effects of agriculturally derived surface water pollutants on aquatic systems − A Review. J Environ Qual 22: 402–408. [CrossRef] [Google Scholar]
- Dodds WK, Smith VH. 2016. Nitrogen, phosphorus, and eutrophication in streams. Inland Water 6: 155–164. [CrossRef] [Google Scholar]
- Dudgeon D, Arthington AH, Gessner MO, Kawabata Z-I, Knowler DJ, Lévêque C, Naiman RJ, Prieur-Richard A-H, Soto D, Stiassny ML. 2006. Freshwater biodiversity: importance, threats, status and conservation challenges. Biol Rev 81: 163–182. [CrossRef] [PubMed] [Google Scholar]
- Dufrêne M, Legendre P. 1997. Species assemblages and indicator species: the need for a flexible asymmetrical approach. Ecol Monogr 67: 345–366. [Google Scholar]
- Durand JR, Lévêque C. 1981. Flore et faune aquatique de l’Afrique sahélo-soudanienne, Tome 1 et Tome II. ORSTOM. I.R.D. France. 873 p. [Google Scholar]
- Edokpayi JN, Odiyo JO, Durowoju OS. 2017. Impact of wastewater on surface water quality in developing countries: A case study of South Africa. In Water Quality: IntechOpen, Vienna, Austria, pp 402–416. [Google Scholar]
- Grimm NB, Faeth SH, Golubiewski NE, Redman CL, Wu J, Bai X, Briggs JM. 2008. Global change and the ecology of cities. Science 319: 756–760. [CrossRef] [PubMed] [Google Scholar]
- Ibezute AC, Asibor GI, Ibezute SU. 2016. Ecological assessment of brewery effluent impact on the macrobenthic invertebrates of Ikpoba River, Edo State, Nigeria. Int J Ecosyst 6: 47–54. [Google Scholar]
- INSAE. 2022. Effectifs de population des villages et quartiers de ville du Bénin. Available at: http://www.insae-bj.org/ [Google Scholar]
- Kaboré I, Moog O, Alp M, Guenda W, Koblinger T, Mano K, Oueda A, Ouedraogo R, Trauner D, Melcher AH. 2015. Using macroinvertebrates for ecosystem health assessment in semi-arid streams of Burkina Faso. Hydrobiologia 766: 57–74. [Google Scholar]
- Kaboré I, Ouéda A, Moog O, Meulenbroek P, Tampo L, Bancé V, Melcher AH. 2022. A benthic invertebrates-based biotic index to assess the ecological status of West African Sahel Rivers, Burkina Faso. J Environ Manag 307: 114503. [CrossRef] [Google Scholar]
- Keke UN, Omoigberale MO, Ezenwa I, Yusuf A, Biose E, Nweke N, Edegbene AO, Arimoro FO. 2021. Macroinvertebrate communities and physicochemical characteristics along an anthropogenic stress gradient in a southern Nigeria stream: implications for ecological restoration. Environ Sustain Indic 12: 1–12. [Google Scholar]
- Koudenoukpo CZ, Chikou A, Toko II, Zébazé Togouet SH, Tchakonté S, Hazoume R, Piscart C, 2017. Diversity of aquatic macroinvertebrates in relationship with the environmental factors of a lotic ecosystem in tropical region: the Sô River in South-East of Benin (West Africa). Int J Fish Aquat Stud 5: 01–10. [Google Scholar]
- Masters WA, Djurfeldt AA, De Haan C, Hazell P, Jayne T, Jirström M, Reardon T. 2013. Urbanization and farm size in Asia and Africa: implications for food security and agricultural research. Glob Food Sec 2: 156–165. [CrossRef] [Google Scholar]
- McCafferty PW. 1983. Aquatic entomology: The fisherman’s and ecologists’ illustrated guide to insects and their relatives, Jones and Bartlett publishers, Boston, London. 448 p. [Google Scholar]
- McKinney ML. 2002. Urbanization, Biodiversity, and Conservation: The impacts of urbanization on native species are poorly studied, but educating a highly urbanized human population about these impacts can greatly improve species conservation in all ecosystems. BioScience 52: 883–890. [CrossRef] [Google Scholar]
- Moisan J. 2010. Guide d’identification des principaux macroinvertébrés benthiques d’eau douce du Québec, 2010: surveillance volontaire des cours d’eau peu profonds. Direction du suivi de l’état de l’environnement, ministère du Développement durable, environnement et parcs, Québec. 82 p. [Google Scholar]
- Moisan J, Pelletier L, Gagnon E, Piedboeuf N, La Violette N. 2013. Guide de surveillance biologique basée sur les macroinvertébrés benthiques d’eau douce du Québec, 2e ed. Direction du suivi de l’état de l’environnement, Québec. 98 p. [Google Scholar]
- Moss B. 2008. Water pollution by agriculture. Philos Trans R Soc B 363: 659–666. [CrossRef] [PubMed] [Google Scholar]
- Mwedzi T, Siziba N, Odume ON, Nyamazana E, Mabika I. 2020. Responses of macroinvertebrate community metrics to urban pollution in semi-arid catchments around the city of Bulawayo, Zimbabwe. Water SA 46: 583–592. [Google Scholar]
- Ngoay-Kossy JC, Zébazé Togouet SH, Wango SP, Bolevane Ouantinam SF, Tchakonté S, Piscart C. 2018. Bioindicators of running freshwaters in Centrafrican Republic: benthic macroinvertebrates and anthropogenic stress in the Nguitto Stream. Rev Ecol 73: 603–616. [Google Scholar]
- Onwona Kwakye M, Peng FJ, Hogarh JN, Van den Brink PJ. 2021. Linking Macroinvertebrates and Physicochemical Parameters for Water Quality Assessment in the Lower Basin of the Volta River in Ghana. Environ Manage 68: 928–936. [Google Scholar]
- Owa FD. 2013. Water Pollution: Sources, Effects, Control and Management. Mediterr J Soc Sci 4: 65–68. [Google Scholar]
- Paul MJ, Meyer JL. 2001. Streams in the urban landscape. Annu Rev Ecol Syst 32: 333–365. [Google Scholar]
- Peralta EM, Batucan Jr LS, De Jesus IBB, Triño EMC, Uehara Y, Ishida T, Kobayashi Y, Ko C-Y, Iwata T, Borja AS, Briones JCA, Papa RDS, Magbanua FS, Okuda N. 2020. Nutrient loadings and deforestation decrease benthic macroinvertebrate diversity in an urbanised tropical stream system. Limnologica 80: 1–14. [Google Scholar]
- Petersen WT, Keister JE. 2003. Interannual variability in copepod community composition at a coastal station in the northern California Current: a multivariate approach. Deep-Sea Res 50: 2499–2517. [Google Scholar]
- R Core Team. 2022. R: A Language and Environment for Statistical Computing. R Foundation for Statistical Computing, R Core Team, Vienna, Austria. Version 4.1.2. [Google Scholar]
- Roberts DW. 2016. labdsv: Ordination and multivariate analysis for ecology. R package version 2. 0-1. Retrieved from https://cran.r-project.org/package=labdsv. [Google Scholar]
- Schwarzenbach RP, Egli T, Hofstetter TB, Gunten UV, Wehrli B. 2010. Global water pollution and human health. Annu Rev Environ Resour 35: 109–136. [CrossRef] [Google Scholar]
- Sterling JL, Rosemond AD, Wenger SJ. 2016. Watershed urbanization affects macroinvertebrate community structure and reduces biomass through similar pathways in Piedmont streams, Georgia, USA. Freshwat Sci 35: 676–688. [CrossRef] [Google Scholar]
- Tachet H, Richoux P, Bournaud M, Usseglio-Polatera P. 2010. Invertébrés d’eau douce: systématique, biologie, écologie. CNRS Editions, 588 p. [Google Scholar]
- Tampo L, Kaboré I, Alhassan EH, Ouéda A, Bawa LM, Djaneye-Boundjou G. 2021. Benthic Macroinvertebrates as Ecological Indicators: Their Sensitivity to the Water Quality and Human Disturbances in a Tropical River. Front. Water 3: 662765. [CrossRef] [Google Scholar]
- Tchakonté S, Ajeagah GA, Camara AI, Diomandé D, Nyamsi Tchatcho NL, Ngassam P. 2015. Impact of urbanization on aquatic insect assemblages in the coastal zone of Cameroon: the use of biotraits and indicator taxa to assess environmental pollution. Hydrobiologia 755: 123–144. [CrossRef] [Google Scholar]
- Tromboni F, Dodds WK. 2017. Relationships between land use and stream nutrient concentrations in a highly urbanized tropical region of Brazil: thresholds and riparian zones. Environ Manage 60: 30–40. [Google Scholar]
- Walmsley JJ. 2002. Framework for measuring sustainable development in catchment systems. Environ Manage 29: 195–206. [Google Scholar]
- Wang H, Wang T, Zhang B, Li F, Toure B, Omosa IB, Chiramba T, Abdel-Monem M, Pradhan M. 2014. Water and wastewater treatment in Africa − current practices and challenges. Clean − Soil, Air, Water 42: 1029–1035. [CrossRef] [Google Scholar]
- Webb BW, Zhang Y. 2004. Intra-annual variability in the non-advective heat energy budget of Devon streams and rivers. Hydrol Process 18: 2117–2146. [CrossRef] [Google Scholar]
- WHO. 2017. Guidelines for drinking-water quality: Fourth edition incorporating the first addendum. 631 p. [Google Scholar]
- Yule CM, Gan JY, Jinggut T, Lee KV. 2015. Urbanization affects food webs and leaf-litter decomposition in a tropical stream in Malaysia. Freshw Sci 34: 702–715. [CrossRef] [Google Scholar]
Cite this article as: Abahi KS, Piscart C, Gnohossou MP. 2024. Responses of the macroinvertebrate community to urban wastewater pollution in the upper Ouémé Basin in Benin. Int. J. Lim. 60: 7:
All Tables
Mean values ± SD of the physical and chemical parameters according to locations and seasons (Cond.: electrical conductivity; Transp.: Transparency; Temp.: Temperature).
Mean values ± SD of the physical and chemical parameters according to locations and seasons. Letters results of Wilcoxon and Kruskal-Wallis tests on “season” and “location”, respectively.
All Figures
|
Fig. 1 Map of the Ouémé Basin showing the urban wastewater discharge points and the sampling locations. |
| In the text | |
|
Fig 2 Results of the principal component analysis (PCA) of the environmental parameters of 30 stations. (a) Correlation circle showing correlations among the 11 environmental parameters (Cond. electrical conductivity; Transp. transparency). (b) Distribution of the barycentres of each location (coloured circles); solid lines link the station to each location and each season to the corresponding location. (c) Distribution of the barycentres of each season; solid lines link the station at each location to the corresponding season. |
| In the text | |
|
Fig. 3 Mean values ± SE of taxonomic richness (a) and the Shannon diversity index (b) according to “location”. “season” and “river”. Letters indicate significant differences from pairwise Tukey’s HSD tests. |
| In the text | |
|
Fig. 4 Mean values ± SE of biological integrity assessment metrics. Letters indicate significant differences from pairwise Tukey’s HSD tests. |
| In the text | |
Current usage metrics show cumulative count of Article Views (full-text article views including HTML views, PDF and ePub downloads, according to the available data) and Abstracts Views on Vision4Press platform.
Data correspond to usage on the plateform after 2015. The current usage metrics is available 48-96 hours after online publication and is updated daily on week days.
Initial download of the metrics may take a while.