| Issue |
Int. J. Lim.
Volume 58, 2022
|
|
|---|---|---|
| Article Number | 15 | |
| Number of page(s) | 11 | |
| DOI | https://doi.org/10.1051/limn/2022014 | |
| Published online | 21 December 2022 | |
Research Article
The response of phytoplankton assemblages to environmental parameters in the Azad Dam Lake in the west of Iran
1
Caspian Sea Ecology Research Center, Iranian Fisheries Science Research Institute, Agricultural Research, Education and Extension Organization (AREEO), Sari, Iran
2
Mersin University, Faculty of Education, Department of Mathematics and Science Education, 33343 Mersin, Turkey
* Corresponding author: This email address is being protected from spambots. You need JavaScript enabled to view it.
Received:
10
December
2021
Accepted:
7
November
2022
Abstract
Seasonal variations of phytoplankton abundance, species composition, and their interaction with environmental parameters were investigated in the Azad Dam Lake, in the West of Iran during 2015–2016. Sampling was conducted seasonally at five stations in the lake. Multivariate statistical analyses were carried out to define the abiotic variables influencing phytoplankton community composition. A total of 51 taxa of phytoplankton belonging to six phyla were identified. Bacillariophyta (diatoms) were most diverse with 22 taxa, comprised more than 90% of the total density. Despite the low Shannon–Wiener index (H ′) diversity (0.10–1.54), pointing out the dominant density of Bacillariophyta resulted in high water quality. Statistical analysis showed seasonal phytoplankton assemblages differences indicating a biogeographical gradient. Distance-based Linear Model (DisTLM) analysis displayed six environmental variables showing significant relationships with the phytoplankton abundance in the resemblance matrix (p < 0.05). Based on Akaike's information criterion (AIC), the combination of total phosphorus (TP), water temperature (WT), Secchi disc depth (SD), total nitrogen (TN), nitrite (NO2−), and dissolved oxygen (DO) by the DisTLM model elucidated 63.1% of the total variability. Since the dam is newly constructed and has not yet been exploited, and the factors caused by human activities that threaten the lake have not yet spread much, findings of the present study suggest Azad Dam Lake appears to have been not highly affected by anthropogenic activities up to now.
Key words: Phytoplankton / community structure / environmental variables / Azad dam / Iran
© EDP Sciences, 2022
1 Introduction
Phytoplankton is a free-floating unicellular and colonial organism that is well adapted to life in different aquatic ecosystems such as rivers, ponds, lakes, and seas being the important component of the primary production in these ecosystems. Phytoplankton as the primary producers play a valuable role in aquatic food webs by releasing oxygen. They respond to many environmental fluctuations indirectly by changing the color of the water and are sensitive to water quality changes (Reynolds, 2006). These microorganisms are also useful as an indicator to assess environmental conditions, trophic status, and water quality (Reynolds, 2006; Koçer and Şen 2012; Isabwe et al., 2018). Also, the abundance, biomass, and species diversity of the phytoplankton are the basic parameters for the evaluation of the trophic status of aquatic environments (Mischke et al., 2008) and optimal managing and exploitation of the various resources (Salmaso, 2002).
Several environmental factors, such as light and nutrients influence the successful reproduction of phytoplankton in aquatic ecosystems (Banse, 1992), and Spatio-temporal heterogeneity is especially strong due to the interlink between the physical and biological processes (Steele, 1985). The diversity of algal communities is straightly related to the community's responses to environmental variations in which ecosystems disturbed by unfavorable anthropogenic effects have lower diversity than non-impacted aquatic ecosystems (Padisák, 1993; Mohebbi et al., 2015).
Besides the socio-economic importance such as providing agricultural irrigation, flood control, and power generation (Zhang et al., 2018a), dam reservoirs are valuable environments and ecological resources. Anthropogenic effects such as nutrient input (Howarth et al., 2002) may cause algal blooms and speed up eutrophication in the aquatic ecosystem (Ma et al., 2014).
Azad Dam reservoir is a large freshwater ecosystem which is located on the Komasi River in northwest Iran, although little is known about its biotic diversity. There is some research on the limnology and fish biology of the Azad Dam Lake (Narollahzadeh Saravi et al., 2017; Roohi et al., 2018; Fazli et al., 2018, 2019) in literature, but the relationship between physicochemical properties and the phytoplankton community was not investigated previously and little known about its diversity. To explore the physical, chemical, and biological relationships between aquatic resources, a reservoir is an ideal ecological-ecosystem to better understand the real ecosystem (Zhang et al., 2018b). Thus, the main objective of this study was to explore the seasonal variation of the phytoplankton community and its interaction with environmental parameters in the Azad Dam Lake in western Iran.
2 Material and methods
2.1 Study area
The study was carried out at the Azad Dam Lake which is located 75 km west of Sanandaj in the west of Iran, at an altitude of about 1400 m sea level. It is an earthen dam (clay core) with a crest length of 595 m, a maximum height of 117 m, and a total capacity of 300 million m3.
The reservoir was constructed in 2011 for irrigation water of Ghorveh and Degolan lands, hydropower production, and drinking water supply, and has economic potential for fisheries resources.
Physicochemical and phytoplankton samples were collected seasonally at five stations in August, November 2015, February, and May 2016 in the Azad dam. Stations 1, 2, and 3 were located in the main open lake at the depths of 100, 80, and 40 m, respectively, and 4 and 5 were in the two different inlet rivers (Fig. 1).
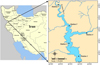 |
Fig. 1 Map of the study area and location of sampling stations in the Azad Dam Lake. |
2.2 Environmental parameters
For physicochemical analysis, samples were collected by Ruttner bottle from different depths at stations 1, 2, and 3 from surface, 3.5, 6 m. Samples of stations 4 and 5 were taken from the surface.
Water and air temperature (WT and AT) were measured using a mercury thermometer. pH and water conductivity (EC) were measured by using WTW823, and the turbidity (Turb) by turbidity meter. Determination of dissolved oxygen (DO) and biological oxygen demand (BOD5) were performed by the Winkler method (APHA, 2017). Chemical oxygen demand (COD) was analyzed by the closed reflux method (APHA, 2017). Nutrients (NH4+/N, NO2−/N, NO3−/N, and PO43–/P) were measured by indophenol, N-naphthyl amin, cadmium reduction, and ammonium molybdate methods using a spectrophotometer (CE2020, CECIL). In addition, to measure total nitrogen (TN) and total phosphorus (TP) concentrations digestion was applied to dissolve organic forms before analysis (Valderrama, 1981). Then these digests were analyzed by spectrophotometer for nitrate and phosphate. The dissolved silicon was determined spectrophotometrically using the molybdosilicon method (Sapozhnikov et al., 1988).
2.3 Phytoplankton species
Niskin Sampler was used to collect phytoplankton samples. The samples were taken at the same depths with physicochemical parameters at stations 1, 2 and 3 from surface, 3.5, 6 m, and at stations 4 and 5 from surface. 500 ml of subsample were immediately preserved with neutral formaldehyde at a 4–5% final concentration until laboratory analyses.
In the laboratory, the samples remained in the dark for 10 days in order to sink materials (phytoplankton) completely, and then the supernatant was drained with a special siphon (a pipe with a narrow curved band, Moncheva et al., 2010). The remaining sample was centrifuged at a speed of 3000 rpm for 5 min to reach a final volume of 20–25 ml. Then, 0.1 ml subsamples were taken from the final volume and phytoplankton species were determined and counted based on dilution factor in two qualitative steps and one quantitative step by the slides and lamellas of 24 × 24 mm, under a microscope with a magnification of 100×, 200×, and 400× (WHO, 1999; APHA, 2017). Phytoplankton abundances were enumerated based on the density of each species which was recorded separately. Finally, according to the dilution factor, the density of each species was calculated (Sourina, 1978).
The species richness (S), the Shannon–Wiener index (H́, using log base e), and the Pielou's evenness (J́) were computed by the DRIVERS routine in the PRIMER package (Clarke and Gorley, 2006).
2.4 Multivariate statistics analysis
Non-metric multidimensional scaling (nMDS) based on the Bray-Curtis similarity measure and square-root transformed data was utilized to define the similarities in the phytoplankton community (Clarke and Warwick, 2001). Similarity percentage (SIMPER) analysis was used to perform to obtain information about changes in seasonal species composition (Clarke, 1993).
PERMANOVA test with seasons was utilized to determine the reaction of these factors on phytoplankton species composition in the Lake. Then, the significant test was analyzed with pairwise comparisons under 9999 permutations (Anderson et al., 2008).
A Distance-based Linear Model (DistLM) was used to analyze the relationships between phytoplankton taxa composition and environmental variables. Before the analysis, the environmental variables were log (X + 1) transformed as suggested by Clarke and Gorley (2006) to reduce right skewness, and the highly correlated environmental variables were removed (Draftsman's plot > 0.8). DistLM was used to clarify the relationships between each diversity indices; single species and environmental variables. DistLM was carried out based on the best procedure and Akaike's information criterion (AIC). The multivariate analysis was performed by PRIMER V.6 and PERMANOVA+ (Clarke and Warwick, 2001; Clarke and Gorley, 2006; Anderson et al., 2008).
3 Results
3.1 Phytoplankton species composition
A total of 51 taxa of phytoplankton belonging to six phyla were identified. Bacillariophyta (diatoms) were most diverse with 22 taxa, followed by the Chlorophyta (15 taxa), Pyrophyta (7 taxa), Cyanophyta (4 taxa), Euglenophyta (2 taxa), and Chrysophyta (1 taxon). In all seasons, Bacillariophyta, Cyclotella menenghiniana, Chlorophyta, Chlorella sp., and Scenedesmus quadricauda reached the highest abundances (Tab. 1).
The lowest density of phytoplankton was in summer (146.8 cells L−1) and the highest was in autumn (3639.0 cells L−1). Chrysophyta exhibited their highest density in summer (comprising 58.8% of the total density). Bacillariophyta was prominent in other seasons and comprised 90.6–96.8% of the total density (Fig. 2).
The lowest and highest values of richness were observed at stations 3 and 4 in winter and 1 in summer (5 and 18), respectively. The highest values of H́ and J́ were observed at stations 2 and 5 in summer (1.54 and 0.59) and the lowest values at station 1 in spring (0.10 and 0.03), respectively (Fig. 3).
Phytoplankton species listed in surface waters of the Azad Dam Lake from 2015 to 2016 (less than 10000 ind/ L−1: * (rare); 10000-100000 ind/L−1: ** (abundant); more than 100000 ind/ L−1: *** (very abundant).
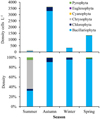 |
Fig. 2 The seasonal density of phytoplankton groups in the Azad Dam Lake. |
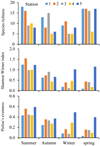 |
Fig. 3 Seasonal changes of species richness, Shannon–Wiener index, and Pielou's evenness at sampling sites 1, 2, 3, 4, and 5 in the Azad Dam Lake. |
3.2 Phytoplankton community structure
The nMDS analysis based on phytoplankton community composition was clustered at a 60% similarity level revealing four distinct groups by season. The first group comprised summer, while the second and third groups comprised station 5 in winter and station 3 in autumn with the highest and lowest gradient, respectively (Fig. 4). The fourth group (with three subgroups) in which autumn, spring, winter and showed vertical gradient.
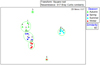 |
Fig. 4 nMDS-ordination based on Bray-Curtis similarity and clustering (groups divided by green circles) of phytoplankton species assemblage composition in five stations (the numbers) and four seasons in the Azad Dam Lake. |
3.3 Environmental data
Table 2 summarizes the investigated environmental parameters. The WT ranged from 6.4 ± 0.05 °C in winter to 24.9 ± 1.18 °C in summer, respectively. The lowest and highest SD depths were in spring and autumn with values of 1.0 ± 0.14 m and 3.0 ± 0.8 m, respectively. The turbidity was the highest in spring (9.5 ± 2.47 NTU) and lowest in winter (2.9 ± 0.84 NTU). The lowest and highest TSS was recorded in winter and spring (0.020 ± 0.001 and 0.029 ± 0.004 mg/l), while the TDS was in spring and winter (125.9 ± 12.83 and 154.9 ± 3.32 mg/l), respectively. The mean values of DO were 8.5 ± 1.89 and 13.1 ± 3.8 mg/l in the summer and spring, respectively. The lowest and highest BOD5 were recorded in summer and spring (1.2 ± 0.82 and 3.5 ± 1.11 mg/l), while the COD was in winter and summer (5.2 ± 1.92 and 11.6 ± 5.35 mg/l), respectively. The mean values of pH were highest in autumn (8.4 ± 0.19) and lowest in autumn (7.4 ± 0.35). The PO43– was highest in summer (0.022 ± 0.012 mg/l) and lowest in spring (0.012 ± 0.004 mg/l), respectively. The mean values of TP and TN were highest in summer (0.146 ± 0.015 mg/l and 17.791 ± 0.083 mg/l), while the lowest was recorded in autumn and spring (0.026 ± 0.002 mg/l and 1.172 ± 0.137 mg/l), respectively. The TN/TP ratios ranged between 12.4 ± 1.28 and 59.9 ± 4.54 in summer and autumn, respectively. The lowest and highest NO2– (0.002 ± 0.001 and 0.004 ± 0.003 mg/l) and NO3– (0.089 ± 0.032 and 0.264 ± 0.085 mg/l) were recorded in summer and autumn, while the NH4+ were in autumn and summer (0.01 ± 0.006 and 0.049 ± 0.049 mg/l), respectively. The SiO2 were highest in spring (0.466 ± 0.296 mg/l) and lowest in summer (0.104 ± 0.014 mg/l), respectively. Finally, the lowest and highest EC were recorded in spring and winter (251.8 ± 25.7 and 309.8 ± 6.6 μs/cm), respectively.
The average (±sd) of environmental parameters are measured in different seasons in the Azad Dam Lake.
3.4 Relationships between phytoplankton composition and environmental variables
SIMPER analysis was used to identify the species' largest changes between seasons (Tab. 3). For instance, four species C. menenghiniana, C. caspica, S. quadricauda, and Chlorella sp. showed marked reductions from autumn to spring and autumn to summer, while D. divergens increased from autumn to summer. C. menenghiniana had a marked reduction from spring to summer, while D. divergens and T. inserta increased in abundance. Notably, from autumn to winter, five species C. menenghiniana, S. quadricauda, C. caspica, Chlorella sp., and T. minimum, and from spring to winter two species C. menenghiniana and S. hantzschii showed marked reductions. Finally, the abundance of C. menenghiniana increased from summer to winter, whereas D. divergens and T. inserta showed marked reductions.
The two-way (stations and seasons) PERMANOVA test defined that species composition was significantly influenced only by seasons (p < 0.001) (Tab. 4). Based on the pairwise comparisons test, all seasons differed significantly (p < 0.05).
Based on Draftman's plot, nine environmental variables were selected to add to the model. DisTLM displayed that among these environmental parameters, six variables had significant relationships with the phytoplankton resemblance matrix (DisTLM, p < 0.001; Tab. 5). The best fit was TP defining 41.8% of the multivariate variability, followed by NO3−, WT, TN, SiO2, and DO (25.7, 22.5, 22.3, 18.8, and 14.3%, respectively). The first axis of DisTLM model was depended on TP (0.97), NO3− (–0.68), TN (0.66), SiO2 (–0.57), WT (0.56), DO (–0.55), and the second axis correlated to WT (0.57), EC (–0.49), and SiO2 (–0.46). Based on AIC criteria, the best fit with the lowest AIC value, the combination of TP, WT, SD, TN, NO2–, and DO explains 78.5% of total variability for resemblance (Bray-Curtis similarities). The first two dbRDA axes of ordination explained 80.4% of the variability (Fig. 5). Thus, this ordination can explain 0.785 × 80.4% = 63.1% of the total variability of the phytoplankton resemblance matrix.
DistLM showed the Shannon–Wiener index (H́) correlated with WT, and TN. For this index, the parameters explained 57.1% of the total variation. The Pielou's evenness (J′) correlated with WT, SD, DO, TP, NO2–, TN, and SiO2 (82.2%) while the species richness (S) related to DO, TN, and EC (66.1%). The distribution of C. menenghiniana was affected by WT, SD, DO, TP, NO2–, and TN (88.0%), while Chlorella sp. was affected by WT, SD, DO, TP, and TN (72.5%). Also, WT, SD, TP, NO2–, and TN explained a 79.6% variation in S. quadricauda distribution (Tab. 6).
SIMPER-analysis for the seasons, where taxa representing 60% of the difference between the groups are included. Abundance (ind/m3), average distance, dissimilarity (AvDis. %), and cumulative average dissimilarity of differences between the groups presented.
PERMANOVA results for phytoplankton assemblage models among four seasons and five stations in the Azad Dam Lake. Significant permutation P values below the 0.05 level are shown in bold.
Results of the individual DistLM-model, containing the Sum of Square (SS), Pseudo-F statistic, p-value, and proportion.
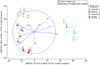 |
Fig. 5 dbRDA plot of Bray Curtis similarity between phytoplankton abundance resemblance and environmental variables. The first two axes of dnRDA ordination explained 80.4% of the variation and 63.1% of the total variability in the species composition. |
Relationship proportions of environmental parameters with diversity indices and three main species of phytoplankton in the Azad Dam Lake.
4 Discussion
4.1 Biodiversity
Dominant species, as active groups, play an important role in judging the status and functioning of the ecosystem. In Azad Dam Lake, Cyclotella menenghiniana (Bacillariophyta) have the highest density and spread all over the area. The researchers' laboratory study showed that the increase in the density of C. menenghiniana starts at a temperature of more than 13 °C and then continues linearly, so that it reaches its maximum growth and density at a temperature of 25 °C (Mitrovic et al., 2010). Therefore, temperature plays an important role in increasing density and reaching the maximum point in Azad Dam Lake in spring and summer. The other important species Chlorella sp. and Scenedesmus quadricaudata (Chlorophyta). Azari et al. (2011) expressed Chlorophyta was the group reaching the highest abundance in spring in the Bukan Reservoir from 2008 to 2009, although this group had the richest diversity in this Reservoir, with the same result of the present study. Meantime Cyanobacteria increased in summer and Chlorophytes were also the group having the highest abundance (44%) in Azad Dam similar to Bistrica Dam Lake, Bulgaria (Dochin and Ivanova, 2015). The finding of some researchers showed Cyanobacteria was the most important taxa in terms of abundance in the Kenyan waters of Victoria Lake in September 1994 and March 1995 (Lung'Ayia et al., 2000). The second most important taxa reaching the highest abundance was Bacillariophyta (Lung'Ayia et al., 2000) that was the same situation and results in Azad dam. Other studies expressed Cyanobacteria was also the group reaching the highest abundances in Aras Reservoir (Mohebbi et al., 2015). Its abundance was the highest in the summer-autumn period. This group was also dominant in Brazil (Huszar et al., 2000; de Souza Barroso et al., 2018). Cyanobacterial blooms are generally major challenges in the proper functioning of aquatic ecosystems (Napiórkowska-Krzebietke, 2014). Some of these blooms resulted in fish death in some studies (Jochimsen et al., 1998; Chellappa and Costa, 2003).
Chrysophyta (species Dinobryon divergens) exhibited their highest density in summer similar to observations in the Zayandehrud Dam Lake (Dorche et al., 2018). Chrysophyta is not seen in winter and the dominance of Dinobryon sp. during spring and summer in the oligotrophic lakes may be attributed to the high water temperature (Onyema, 2008).
Bacillariophyta was the most important phytoplankton group in terms of density (formed 53% of total abundance) in the Zayandehrud River Dam Lake in 2014 (Dorche et al., 2018). Chlorophyta was the second prominent phytoplankton phylum in the mentioned study.
Total cell numbers counted in this study ranged from 100 to 3500 cells L−1 and they were lower than abundances recorded in many distinct reservoirs in different periods (Asadian et al., 2020; Azari et al., 2011; Dochin and Ivanova, 2015; Lung'Ayia et al., 2000; Mohebbi et al., 2015). Low cell abundances also indicate the oligotrophic status of the study region. Furthermore, the dominance of Bacillariophyta in abundance during the majority of the year in this study may also show the healthy environmental status of the region since diatoms (such as Cyclotella menenghiniana) are bio-indicators of clean waters (Teubner, 2003; Sakset and Chankaew 2013; Mohebbi et al., 2015).
In this study, diatoms were dominant in the spring, autumn, and winter periods and comprised more than 90% of the total density. Confirming our findings, Irwin et al. (2012) and Mohebbi et al. (2015) reported that diatom species were mostly found in cool waters. Concordant with high nutrient concentrations in autumn and spring, phytoplankton abundance was also high in these periods in this study.
The Shannon–Wiener index (H́) of the Azad Dam Lake was lower when abundance was high in autumn, winter, and spring (∼0.10–0.5) than in summer (1–1.5). These low H́ values could be fitted to the high dominance of Bacillariophyta. Similar to the present study, low H́ values were also observed in Aras Reservoir by Mohebbi et al. (2015) because of the dominance of Cyanophyta in all seasons.
4.2 Environmental variables
Nitrate and phosphate concentrations measured in this study were lower than in most reservoirs. Nitrate concentrations measured in Azad Dam Lake in the present study were about 30 times lower than in Bukan Dam Reservoir (Azari et al., 2011) and Zayandehrud River Dam Lake (Asadian et al., 2020), ten times lower than in Zayandehrud Dam Lake (Dorche et al., 2018). Total nitrogen concentration was about two times lower in this study than in Aras Reservoir (Mohebbi et al., 2015) and 2–10 times lower than a lake in Bulgaria, Bistrica Dam Lake (Dochin and Ivanova, 2015). Nitrate concentrations measured here were comparable to the ones recorded in Shahrchai Dam Reservoir, Uramia-Northwest Iran, however, phosphate concentrations in Shahrchai Dam Reservoir were >100 times higher than in this investigation (AsadpourOsalou et al., 2017). Phosphate concentrations were about 10 times lower than in Bukan Dam Reservoir which is located in northwestern Iran (Azari et al., 2011), 2–5 times lower than in Zayandehrud Dam Lake (Dorche et al., 2018), 30–40 times lower than in Bistrica Dam Lake, Bulgaria (Dochin and Ivanova, 2015) and 30–90 times lower than in Zayandehrud River Dam Lake (Asadian et al., 2020). Total phosphorus concentrations were about ten times lower in the Azad Dam lake than in the Aras reservoir (Mohebbi et al., 2015). Nitrate and Phosphate concentrations are efficient tools for determining the trophic state of water bodies (Yun and An, 2016). According to the Modified Carlson classification for trophic status, regions having nitrate concentrations in the range of 0.307–1.630 mg/l and phosphate levels of 0.0037–0.017 mg/l are considered oligotrophic (Asadian et al., 2020). Consequently, based on these values, Azad Dam Lake appears as oligotrophic. Also, N/P ratios were higher than Redfield ratios (16) in all seasons except summer in the present study. This may show phosphorus limitation during autumn, winter, and spring but nitrate limitation during summer.
The minor changes in electrical conductivity (EC) values in the Lake were similar to observations in the Zayandehrud Dam Lake (Dorche et al., 2018), which could be related to hydrological conditions and temperature (Makhlough, 2008). In the present study, pH was close to 8 which was often related to photosynthetic activity and decomposition of organic matter (Moss, 1998; Oguzkurt and Ozhan, 2008).
4.3 Phytoplankton community and related environmental variables
The nMDS ordination showed that the seasonal changes were the reason for the main changes in the phytoplankton community, rather than spatial ones. The PERMANOVA test also confirmed the phytoplankton community was significantly influenced by seasons.
The phytoplankton community structure of Azad Dam Lake presented a high correlation with TP (0.97), NO3– (–0.68), TN (0.66), SiO2 (–0.57), WT (0.54), and DO (–0.55). Based on AIC, the combination of TP, WT, SD, TN, NO2–, and DO elucidated 63.1% of the total variability. The three most abundant phytoplankton species and diversity indices were mostly affected by WT, SD, DO, TP, TN, and NO2–. Previous studies have revealed that nutrient enrichment highly influences phytoplankton composition (Davies and Ugwumba, 2013) and each phytoplankton group showed a unique spatial pattern in response to N and P concentrations (Armitage et al., 2006). In general, in freshwater ecosystems, phosphorus is the limiting nutrient for phytoplankton growth (Hecky and Kilham, 1988). In general, nitrogen input favours the growth of Bacillariophyta and Chlorophyta while Cyanobacteria growth is limited by phosphorus input and temperature increase (e.g. Paerl and Huisman, 2008; Dokulil and Teubner, 2000; Huszar et al., 2000; Liu et al., 2011; Mohebbi et al., 2015; de Souza Barroso et al., 2018). In the case of Azad Dam Lake, the highest TP (low TN/TP ratio, 12.4), and the temperature occurred in summer when the Chrysophyta density was increased to the highest level. In contrast, the abundance of Bacillariophyta was linked to high TN concentrations (higher TN/TP ratios) and low temperatures. It is pointed out that higher TN and lower WT resulted in the replacement of Chrysophyta by Bacillariophyta as the dominant phytoplankton group.
5 Conclusion
The results of the present study showed that Azad Dam Lake was oligotrophic, with its phytoplankton communities exhibiting a seasonal pattern, and being dominated by Bacillariophyta which resulted in low diversity. Furthermore, according to DistLM analysis, the combination of TP, WT, SD, TN, NO2–, and DO might be key-driven factors in the phytoplankton resemblance matrix. It is revealed that the abundance of Bacillariophyta was linked to high TN and low temperature, and Chrysophyta density was dependent on high TP and temperature. Since the Azad dam is new construction and its low abundance of Cyanobacterial, as an indicator of pollution due to the concentration of nutrients, it seems there were not any blooms that are generally caused major challenges in the proper functioning of aquatic ecosystems. On the other hand, as the dam is newly constructed and has not yet been exploited, and the factors caused by human activities (such as nutrient input) that threaten, the lake have not yet spread much, findings of the present study suggest Azad Dam Lake appears to have been not highly affected by anthropogenic activities up to now.
Acknowledgments
We are grateful to the Jihad-Agriculture of Kurdistan Organization which supported this study.
References
- Anderson MJ, Gorley RN, Clarke KR. 2008. PERMANOVA+for PRIMER: Guide to Software and Statistical Methods. PRIMER-E, Plymouth, UK: 218 p. [Google Scholar]
- APHA (AmericanPublic Health Association). 2017. Standard method for examination of water and wastewater. American public health association publisher, 19th edition, Washington: APHA, 1113 p. [Google Scholar]
- Armitage AR, Frankovich TA, Fourqurean JW. 2006. Variable responses within epiphytic and benthic microalgal communities to nutrient enrichment. Hydrobiologia 569: 423–435. [CrossRef] [Google Scholar]
- Asadian N, Chamani A, Abolhasani MH. 2020. The trophic status of the Zayandeh River dam lake in the spring and summer, 2017. Int J of Aqua Biol 8: 209–215. [Google Scholar]
- Asadpourosalou YA, Mohebbi F, Seidgar M, Ghezelbash F. 2017. The effects of physico-chemical parameters on the phytoplankton population of Shahrchai Dam Reservoir (Uramia-Northwest Iran). J Phycological Res 1: 93–102. [Google Scholar]
- Azari AM, Mohebbi F, Asem A. 2011. Seasonal changes in phytoplankton community structure in relation to physico-chemical factors in Bukan dam reservoir (northwest Iran). Turk J Botany 35: 77–84. [Google Scholar]
- Banse K. 1992. Grazing, temporal changes of phytoplankton concentrations, and the microbial loop in the open sea. In Primary Productivity and Biogeochemical Cycles in the Sea (pp. 409–440). Boston, MA: Springer. [CrossRef] [Google Scholar]
- Chellappa NT, Costa MAM. 2003. Dominant and co-existing species of Cyanobacteria from a Eutrophicated reservoir of Rio Grande do Norte State, Brazil. Acta Oecolog 24: S3– S10. [CrossRef] [Google Scholar]
- Clarke KR. 1993. Non‐parametric multivariate analyses of changes in community structure. Austr J Ecol 18: 117–143. [CrossRef] [Google Scholar]
- Clarke KR, Gorley RN. 2006. PRIMER version 6: user manual/tutorial. PRIMER-E, 192 p. [Google Scholar]
- Clarke KR, Warwick RM. 2001. Change in marine communities: An approach to Statistical Analysis and Interpretation. 2nd edn. Plymouth, UK: PRIMER-E, 176 p. [Google Scholar]
- Davies OA, Ugwumba OA. 2013. Tidal influence on nutrients status and phytoplankton population of Okpoka Creek, Upper Bonny Estuary, Nigeria. J Mar Biol 2013: 1–16 [CrossRef] [Google Scholar]
- de Souza Barroso H, Santos JA, Marins RV, Lacerda LD. 2018. Assessing temporal and spatial variability of phytoplankton composition in a large reservoir in the Brazilian northeastern region under intense drought conditions. J Limnol 77: 130–146. [Google Scholar]
- Dochin K, Ivanova A. 2015. Study of phytoplankton diversity and hydrochemical regime of Bistrica Dam Lake. Bulgar J Agric Sci 21: 137–146. [Google Scholar]
- Dokulil MT, Teubner K. 2000. Cyanobacterial dominance in lakes. Hydrobiologia 438: 1–12. [CrossRef] [Google Scholar]
- Dorche EE, Shahraki MZ, Farhadian O, Keivany Y. 2018. Seasonal variations of plankton structure as bioindicators in Zayandehrud Dam Lake, Iran. Limnol Rev 18: 157–165. [CrossRef] [Google Scholar]
- Fazli H, Daryanabard G, Janbaz A, Mirzaei R, Hoseinpour H, Vahedi N. 2018. Some biological characteristics of Carassius gibelio (Bloch, 1782) (Teleostei: Cyprinidae) in the Azad dam Lake in Western Iran. Iran J Ichthyol 5: 243–249. [Google Scholar]
- Fazli H, Daryanabard G, Janbaz A, Naderi Jolodar M, Mirzaei R, Hoseinpour H, Vahedi N. 2019. Age and growth of Alburnus mossulensis Heckel, 1843 in Azad Dam Reservoir and Komasi River in Kordestan Province, Iran. Iran J Fish Sci 18: 672–683. [Google Scholar]
- Hecky RE, Kilham P. 1988. Nutrient limitation of phytoplankton in freshwater and marine environments: a review of recent evidence on the effects of enrichment 1. Limnol Oceanog 33: 796–822. [Google Scholar]
- Howarth R, Sharpley A, Walker D. 2002. Sources of nutrient pollution to coastal waters in the United States: implications for achieving coastal water quality goals. Estuaries 25: 656–676. [CrossRef] [MathSciNet] [Google Scholar]
- Huszar VLM, Silva LHS, Marinho M, Domingos P, Santanna CL. 2000. Cyanoprokaryote assemblages in eight productive tropical Brazilian waters. Hydrobiologia 424: 67–77. [CrossRef] [Google Scholar]
- Irwin AJ, Nelles AM, Finkel ZV. 2012. Phytoplankton niches estimated from field data. Limnol Oceanog 57: 787–797. [CrossRef] [Google Scholar]
- Isabwe A, Yang JR, Wang Y, Liu L, Chen H, Yang J. 2018. Community assembly processes underlying phytoplankton and bacterioplankton across a hydrologic change in a human-impacted river. Sci Total Environ 630: 658–667. [PubMed] [Google Scholar]
- Jochimsen EM, Carmichael WW, An J, et al. 1998. Liver failure and death after exposure to microcystins at a hemodialysis center in Brazil. N Engl J Med 338: 873–878. [CrossRef] [PubMed] [Google Scholar]
- Liu X, Lu X, Chen Y. 2011. The effects of temperature and nutrient ratios on Microcystis blooms in Lake Taihu, China: an 11-year investigation. Harmful Algae 10: 337–343. [CrossRef] [Google Scholar]
- Lung'Ayia HB, M'harzi A, Tackx M, Gichuki J, Symoens JJ. 2000. Phytoplankton community structure and environment in the Kenyan waters of Lake Victoria. Freshw Biol 43: 529–543. [CrossRef] [Google Scholar]
- Ma J, Brookes JD, Qin B, Paerl HW, Gao G, Wu P, Zhang W, Deng J, Zhu G, Zhang Y, Xu H. 2014. Environmental factors controlling colony formation in blooms of the cyanobacteria Microcystis spp. in Lake Taihu, China. Harmful Algae 31: 136–142. [CrossRef] [PubMed] [Google Scholar]
- Makhlough A. 2008. Water quality characteristics of Mengkuang reservoir based on phytoplankton community structure and physico-chemical analysis [Master thesis], University of Science, Malaysia, Penang: 43 p. [Google Scholar]
- Mischke U, Riedmuller U, Hoehn E, Schonfelder I, Nixdorf B. 2008. Description of the German system for phytoplankton-based assessment of lake for implementation of the EU Water Framework Directive (WDF). In: Review of lakes by phytoplankton for implementation of EU Wasserrachmenrichtlinie (Eds) U. Mischke, B. Nixdorf, Actuelle series 2/2008, Bad Saarow Freiburg, Berlin. University of Cottbus: pp. 117–146. [Google Scholar]
- Mitrovic SM, Hitchcock JN, Davie AW, Ryan DA. 2010. Growth responses of Cyclotella meneghiniana (Bacillariophyceae) to various temperatures, Short communication. J Plankton Res 32: 1217–1221. [CrossRef] [Google Scholar]
- Mohebbi F, Riahi H, Sheidaei M, Shariatmadari Z, Manaffar R. 2015. Environmental control of the dominant phytoplankton in Aras Reservoir (Iran): a multivariate approach. Lakes Reserv: Res Man 20: 206–215. [Google Scholar]
- Moncheva S, Parr B, Sarayi D, Hareket II. 2010. Manual for phytoplankton sampling and analysis in the black sea. Phyto Manu UP-GRADE Black Sea Scene Project, FP7, 226592. [Google Scholar]
- Moss B. 1998. Ecology of freshwaters: Man and medium, Past to future. Oxford: Blackwell Science, 387 p. [Google Scholar]
- Napiórkowska-Krzebietke A. 2014. Phytoplankton of artificial ecosystems − an attempt to assess water quality. Fish Aqua Life 22: 81–96. [Google Scholar]
- Narollahzadeh Saravi H, Parafkandeh F, Fazli H, Mirzaei R, Hosseinpour H, Afraei MA, Nasrollahtabar A, Makhlough A, Vahedi N. 2017. Study on physico-chemical characteristics of Azad dam reservoir (Sanandaj) in order to fisheries activities. Iran Sci Fish J (In Persian) 25: 157–143. [Google Scholar]
- Oguzkurt D, Ozhan D. 2008. Bioindicator benthic macro-invertebrate for assessing water quality: A case study on Karakaya Dam Lake, Proceedings of Taal 2007: The 12th World Lake Conference, Jaipur, pp. 2148–2153. [Google Scholar]
- Onyema IC. 2008. A checklist of phytoplankton species of the Iyagbe lagoon, Lagos. J Fish Aqua Sci 3: 167–175. [Google Scholar]
- Padisák J. 1993. The influence of different disturbance frequencies on the species richness, diversity and equitability of phytoplankton in shallow lakes. Hydrobiologia 249: 135–156. [CrossRef] [Google Scholar]
- Paerl HW, Huisman J. 2008. Blooms like it hot. Science 320: 57–58. [Google Scholar]
- Reynolds CS. 2006. The ecology of phytoplankton. Cambridge University Press, 535 p. [Google Scholar]
- Roohi A, Naderi Jolodar M, Nasrollazadeh H, Fazli H, Afraei Bandpaei MA, Rowshantabari M, Makhlogh A, Tahami FS, Khodaparast N, Mirzaei R, Hossienpour H. 2018. Natural production assessment of Azad Sanandaj reservoir to produce fish. J Aquac Dev 12: 29–49. [Google Scholar]
- Sakset A, Chankaew W. 2013. Phytoplankton as a bio-indicator of water quality in the freshwater fishing area of Pak Phanang River Basin (Southern Thailand). Chiang Mai J Sci 40: 344–355. [Google Scholar]
- Salmaso N. 2002. Ecological patterns of phytoplankton assemblages in Lake Garda: seasonal, spatial and historical features. J Limnol 61: 95–115. [CrossRef] [Google Scholar]
- Sapozhnikov VN, Agativa AE, Arjanova NV, Nalitova EA, Mardosova NV, Zobarowij VL, Bandarikov EA. 1988. Methods of hydrochemical analysis of the major nutrients. Moscow, Russia, VNIRO, 75 p. [Google Scholar]
- Sourina A. 1978. Phytoplankton manual. United Nations Educational, Scientific & Culture Organization: 337 p. [Google Scholar]
- Steele JH. 1985. A comparison of terrestrial and marine ecological systems. Nature 313: 355–358. [CrossRef] [Google Scholar]
- Teubner K. 2003. Phytoplankton, pelagic community and nutrients in a deep oligotrophic alpine lake: ratios as sensitive indicators of the use of P-resources (DRP: DOP: PP and TN: TP: SRSi). Water Res 37: 1583–1592. [CrossRef] [PubMed] [Google Scholar]
- Valderrama JC. 1981. The simultaneous analysis of total nitrogen total phosphorus in natural waters. Mar Chem 10: 109–122. [CrossRef] [Google Scholar]
- WHO. 1999. Toxic Cyanobacteria in Water: A Guide to their Public Health Consequences, Monitoring, and Management. Geneva: World Health Organization. [Google Scholar]
- Yun YJ, An KG. 2016. Roles of N: P ratios on trophic structures and ecological stream health in lotic ecosystems. Water 8: 1–19. [Google Scholar]
- Zhang H, Jia J, Chen S, Huang T, Wang Y, Zhao Z, Feng J, Hao H, Li S, Ma X. 2018a. Dynamics of bacterial and fungal communities during the outbreak and decline of an algal bloom in a drinking water reservoir. Int J Environ Res Public Health 15: 361. [CrossRef] [PubMed] [Google Scholar]
- Zhang H, Zhou X, Wang L, Wang W, Xu J. 2018b. Concentrations and potential health risks of strontium in drinking water from Xi'an, Northwest China. Ecotoxil Environ Saf 164: 181–188. [CrossRef] [Google Scholar]
Cite this article as: Fazli H, Tahami FS, Saravi HN, Roohi A, Eker-Develi E, Daryanabard GR, Vahedi F. 2022. The response of phytoplankton assemblages to environmental parameters in the Azad Dam Lake in the west of Iran. Int. J. Lim. 58: 15:
All Tables
Phytoplankton species listed in surface waters of the Azad Dam Lake from 2015 to 2016 (less than 10000 ind/ L−1: * (rare); 10000-100000 ind/L−1: ** (abundant); more than 100000 ind/ L−1: *** (very abundant).
The average (±sd) of environmental parameters are measured in different seasons in the Azad Dam Lake.
SIMPER-analysis for the seasons, where taxa representing 60% of the difference between the groups are included. Abundance (ind/m3), average distance, dissimilarity (AvDis. %), and cumulative average dissimilarity of differences between the groups presented.
PERMANOVA results for phytoplankton assemblage models among four seasons and five stations in the Azad Dam Lake. Significant permutation P values below the 0.05 level are shown in bold.
Results of the individual DistLM-model, containing the Sum of Square (SS), Pseudo-F statistic, p-value, and proportion.
Relationship proportions of environmental parameters with diversity indices and three main species of phytoplankton in the Azad Dam Lake.
All Figures
|
Fig. 1 Map of the study area and location of sampling stations in the Azad Dam Lake. |
| In the text | |
|
Fig. 2 The seasonal density of phytoplankton groups in the Azad Dam Lake. |
| In the text | |
|
Fig. 3 Seasonal changes of species richness, Shannon–Wiener index, and Pielou's evenness at sampling sites 1, 2, 3, 4, and 5 in the Azad Dam Lake. |
| In the text | |
|
Fig. 4 nMDS-ordination based on Bray-Curtis similarity and clustering (groups divided by green circles) of phytoplankton species assemblage composition in five stations (the numbers) and four seasons in the Azad Dam Lake. |
| In the text | |
|
Fig. 5 dbRDA plot of Bray Curtis similarity between phytoplankton abundance resemblance and environmental variables. The first two axes of dnRDA ordination explained 80.4% of the variation and 63.1% of the total variability in the species composition. |
| In the text | |
Current usage metrics show cumulative count of Article Views (full-text article views including HTML views, PDF and ePub downloads, according to the available data) and Abstracts Views on Vision4Press platform.
Data correspond to usage on the plateform after 2015. The current usage metrics is available 48-96 hours after online publication and is updated daily on week days.
Initial download of the metrics may take a while.