| Issue |
Ann. Limnol. - Int. J. Lim.
Volume 57, 2021
|
|
|---|---|---|
| Article Number | 16 | |
| Number of page(s) | 17 | |
| DOI | https://doi.org/10.1051/limn/2021013 | |
| Published online | 11 August 2021 | |
Research Article
Historical analysis of a karst aquifer: recharge, water extraction, and consumption dynamics on a tourist island (Cozumel, Mexico)
1
Universidad de Quintana Roo, Campus Cozumel, Avenida Andrés Quintana Roo, Calle 11 con calle 110 sur s/n. C.P. 77642. Cozumel, Quintana Roo
2
Instituto Potosino de Investigación Científica y Tecnológica, A.C. División de Geociencias Aplicadas, Camino a la Presa San José 2055, Col. Lomas 4ta Sección, San Luis Potosí, C.P. 78216. San Luis Potosí, Mexico
* Corresponding author: This email address is being protected from spambots. You need JavaScript enabled to view it.
Received:
20
April
2021
Accepted:
18
July
2021
Abstract
On Cozumel Island, access to freshwater depends on the extraction of the resource from the aquifer located north of the island (catchment area). Water resource management on the island must be based on updated knowledge of the indicator dynamics related to the recharge of the aquifer, groundwater extraction and the distribution of the resource. In this study, trends, variations and time series of 30 years of monthly data for precipitation, temperature, evapotranspiration, and estimated aquifer recharge were calculated for the catchment area. Additionally, groundwater extraction, water consumption for the main uses over a 13-year period (monthly data), and the 5-year status of wells were considered. The results show decreasing trends in precipitation and estimated recharge volumes in the catchment area, in addition to increasing trends in mean air temperature, evapotranspiration, water extraction volumes and consumption by the commercial sector for the considered time periods. Additionally, an increase in dejected (77%) and reposed (38%) wells within the catchment area was observed. Evidence from this study suggests a dynamic behaviour of the analysed indicators over time that increases pressure on karstic, Caribbean aquifers for which monthly monitoring and data analysis are encouraged as the basis for adequate management.
Key words: Aquifer sustainability / groundwater management / Mann Kendall trend test / time series / water consumption
© G. Hernández-Flores et al., Published by EDP Sciences, 2021
 This is an Open Access article distributed under the terms of the Creative Commons Attribution License (https://creativecommons.org/licenses/by/4.0), which permits unrestricted use, distribution, and reproduction in any medium, provided the original work is properly cited.
1 Introduction
Coastal aquifers (CAs) are a valuable source of freshwater for the coastal environment well-being of over 60% of the global population that is concentrated around the shoreline (Zepeda et al., 2018) and 11% that lives on islands (Mendoza-Vizcaino et al., 2016). Aquifers near coastal areas are susceptible and sometimes unable to cope with the adverse effects of overextraction (Jaleel et al., 2020; Zepeda et al., 2018), sea water intrusion (Deng et al., 2017), pollution (Hernández-Terrones et al., 2011; Kammoun et al., 2021), and climate change effects, such as rainfall pattern modification and sea level rise (Cashman, 2014; GWP, 2014; Hall et al., 2013; Pulido-Velazquez et al., 2018). Because of their nearness to the sea, CAs and island aquifers (IAs) share similarities, although IAs are unique in that they are confined to a geographical area. Also, IA territory may typically correspond only to one country, and rainwater infiltration is the main source of recharge (Falkland, 1993), with most systems being just as complex as continental counterparts that require particular assessment for management (Gamble, 2004). These characteristics allow an IA to be an ideal model and scenario for research on aquifer recharge, groundwater withdrawals and water demand, which will contribute to further understanding IA dynamics as the basis for sustainable water management.
Cozumel is the third largest island in Mexico and the most populated island, located in the southeastern State of Quintana Roo, where the drinking water supply depends on the aquifer recharged only by rain (Gutiérrez-Aguirre et al., 2008). Like in many other karstic nature islands, rainwater rapidly infiltrates into the aquifer, although they are highly vulnerable to pollution infiltration and water scarcity (Medici et al., 2019, 2020). Vulnerability is an intrinsic property of karstic island aquifers, which depends on characteristics of the area and the sensitivity of the system to human and natural impacts (Ducci and Sellerino, 2013; Kačaroğlu, 1999; Medici et al., 2021), such as wastewater infiltration, hurricanes and saltwater intrusions. Seawater intrusion can be a consequence from the reduction of the freshwater layer, as the piezometric level lowers by an increase in evapotranspiration and unsustainable water extraction volumes from wells (Villasuso et al., 2011). Water scarcity on islands is a fundamental factor that limits population development and tourism (the main economic activity on Cozumel), and research is needed to promote the sustainable use of water (González et al., 2020). In Mexico, federal water management is mostly performed by the National Water Commission (CONAGUA), and in Cozumel, the Potable Water and Sewerage Commission (CAPA) is the local agency for water management. CAPA is a governmental institution that monitors water quality indicators and administers the extraction, potabilization, and distribution of water withdrawn from a series of 264 wells located in the central-north region of the island (catchment area) (Tercera Legislatura Constitucional del Estado de Quintana Roo, 2017). Water management in the catchment area is focused on selecting the most suitable wells, according to their water quality indicators, for extraction, and infrastructure maintenance.
Similarly, central gestion related with the water management is applied in other tropical, karst islands (based almost exclusively upon static indicators), then it could be complemented by identifying the dynamics of indicators related to groundwater recharge (precipitation, evapotranspiration, estimated aquifer recharge) and withdrawals (groundwater extraction, the state of wells, and water consumption volumes) as part of an integrative approach to sustainable aquifer management. An integrative approach allows the synthesis and analysis of information about the aquifer dynamics, being an excellent resource for users, stakeholders and managers of information about past trends and current status to encourage practices that promote aquifer sustainability. The use of test for trends, boxplots, and time series are common statistical tools for analysing variations over a time period, which allow us to identify an increase or decrease in values, seasonality and outliers (Neeti et al., 2012; Nwogu et al., 2016). Mann-Kendall test is recommended by the World Meteorological Organization and has been used by several authors for evaluating the trend in climatic, hydrological and water resources data (Jaiswal et al., 2015). Although these tools have not yet been used fully to analyse information previously for Cozumel, there are examples of their implementation in other studies for the Yucatan Peninsula (Bautista et al., 2009; Herrera-Silveira et al., 2002; Rodríguez-Huerta et al., 2019a, 2019b).
Current water management information on precipitation and recharge are generally annual and are sometimes not updated in tropical latitudes, a situation that is shared with information on aquifer withdrawals and distribution, and that contributes to the assumption of indicators static behaviour. This study hypothesizes that the indicators associated with the aquifer are dynamic and subject to variations over time, for which they must be monthly updated and analysed for a better understanding of their current state. The objective of this study is to analyse the dynamics of indicators as precipitation, air temperature, evapotranspiration used in estimated aquifer recharge, water withdrawals and distribution in different time periods for Cozumel. This analysis helped to identify variations over time in the hydrometeorological indicators (precipitation and temperature) related to aquifer estimated recharge and hydrological indicators (the exploitation of resources and distribution) on the island to understand the current situation and contribute information to the sustainable management of water resources.
2 Materials and methods
2.1 Study area
Cozumel (20°16′ − 20°26′N and 86°44′ − 87°02′W) is a karstic island in the Caribbean, located 20 km from the East Coast of the Yucatan Peninsula with a surface area of 477 km2 and a maximum length of 48 km from north to south and 14.8 from east to west (Gompper et al., 2006; Orellana et al., 2007). The territory has slight slopes with an average elevation of 5 m; the highest elevation (10 m) is located in the south-center region (Fig. 1) (Ward, 1997). The island is formed by limestone, where most of the soils are Leptosol, with a few patches of Gleysol in the centre-east and Arenosol near the coast of the southeast (Gutiérrez-Aguirre et al., 2008; INEGI, 2013). The climate is classified as warm subhumid (Aw) according to the Köppen system, with temperatures ranging from 23 to 27.5 °C (García-Gómez et al., 2014; Orellana et al., 2007). The annual average precipitation is divided, being 1400–1500 mm on most of the island and 1300–1400 mm on the far northeast, with a rainy season from June to December and a dry season from January to May (García-Gómez et al., 2014; Orellana et al., 2007).
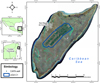 |
Fig. 1 Location of CAPA wells, UGA C1, elevations and stratigraphy column on Cozumel Island. Modified of Local Ecological Zoning Plan (2008). |
2.1.1 Vegetation, soil and bedrock geology
Vegetation is composed mainly of subdeciduous tropical forest, subdeciduous low tropical forest and mangroves (Escalante, 1996; Téllez et al., 1989), covering approximately 90% of the island surface with native species as: Manilkara zapota, Bursera simaruba, Enriquebeltrania crenatifolia, and Pithecellobium menguense (Vázquez-Domínguez et al., 2012). In the analysed UGA C1 (Fig. 1), most of the surface is medium forest (Escalante, 1996).
The island soilscape is composed mainly of shallow soils, which are found as patches that fill cracks in the rocks (Bautista et al., 2011; CONAGUA, 2015). Karst environments with similar characteristics have soil depths from 4–15 cm, where most of the fertility is found in the uppermost part of the horizons and depends on the decomposition of organic matter (Flores-Delgadillo et al., 2011; Holden et al., 2019). The island was developed in the late Mesozoic and Cenozoic via block faulting from Yucatán Peninsula, with two periods of submergence and two periods of exposure on the late Pleistocene (Gompper et al., 2006; Ward, 1997). Cozumel is part of the “Carrillo Puerto” formation which developed between Eocene and mio-Pliocene (CONAGUA, 2015). The lithology is structured as four units (Fig. 1), Cozumel Formation and three more recent units, named: Mirador, Abrigo and Chankanaab Formations (Lesser et al., 1978). The youngest rocks date from the Quaternary and are composed mainly of calcarenites, gravels, calcareous sands and fragments of shells deposited alongside the shore thought the island, except for most of the west side (Richards, 1937; SECTUR, 2018). The Island constitutes the emerged part of a structural pillar (horst), limited by two large normal faults parallel to the eastern coast of the Peninsula, and where three structural elements make up the island: Eastern normal fault, Western normal fault, and Cozumel Anticline (CONAGUA, 2015).
2.1.2 Hydrology
Since 1978, the aquifer has been characterized as a freshwater lens, for most of the territory subsurface, that floats over seawater and has a water table from 1 m on the east to 5 m on the centre-south (Hernández-Flores et al., 2020; Lesser et al., 1978). This freshwater lens model corresponds with the Ghyben-Herzberg principle, which states that the thickest part of the lens is in the centre and thins as it approaches the shoreline, where it naturally discharges into the sea mostly by underwater springs (Gamble, 2004; Sánchez y Pinto et al., 2015). The aquifer is described as nonconfined, highly permeable, heterogenous due to the hydraulic properties and irregular terrain distribution caused by the dissolution of the rock (SECTUR, 2018). The island has a typical karstic topography with the presence of sinkoles (cenotes) as a result of dissolution processes (Lesser et al., 1978). An infiltration of 6% of total rainfall is considered and surface runoff is negligible because of the karstic nature of the area (Wurl et al., 2003). Water quality on the aquifer is very similar to the one in the Yucatan Peninsula, being of a Ca(HCO3)2 type as a result of the dissolution of limestones (anhydrite and halite) (CONAGUA, 2015; Escolero et al., 2005; Richards, 1937). The main source of recharge is rainwater infiltration, and due to orography, the main catchment area is located at the centre, slightly to the northeast (Frausto-Martínez et al., 2018), concurring with UGA C1. In this area, wells from CAPA extract water from the thickest freshwater lens on the island (SECTUR, 2018). According to the Local Ecological Zoning Plan (POEL), these wells are within 68.85 km2 and make up Environmental Management Unit C1 (UGA C1), which has the purpose of preserving the natural cover to ensure aquifer water quality and quantity. To prevent issues from water depletion in wells, an approximate of 2.3 million m3/year safe water yield was estimated in 1978 (Lesser et al., 1978).
2.2 Methodology and data collection
For this study, three sets of data from different time periods were analysed (Fig. 2). These time periods were considered based on the availability of the information.
Monthly information from hydrometeorological indicators (total precipitation and mean temperature) from 30 years (1989 to 2019) was provided by the National Water Commission (CONAGUA) from meteorological station DGE 00,023,048 (20.5100° N − 86.9461° W) into the study area. Although most of the readings from the meteorological station were available, some of them were missing due to technical problems. Missing monthly data were obtained from the Climate Forecast System Reanalysis (CFSA) reports from The National Centers for Environmental Prediction (NCEP) with the meteorological station located at 20.583° N, −86.817° W. Precipitation data corresponded to monthly total mm and temperature data corresponded to mean temperature values.
Monthly water hydrological indicator data (extraction volumes from wells at UGA C1 and distribution volumes to different sectors) were provided by CAPA for a 13-year period (2005 to 2018), along with annual well status for 5 years (2013–2018). According to local regulations (Tercera Legislatura Constitucional del Estado de Quintana Roo, 2017), CAPA is allowed to distribute water for the following uses by sector: commercial, domestic, general services, hotels, industry and aquatic parks, with the latter nonexistent in Cozumel.
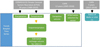 |
Fig. 2 Schematic framework of the methods used in this research. In grey, information sources and considered time periods. Green indicates hydrometeorological and hydrological indicators. In dark blue, analysis performed to indicators. In blue cyan, information represented in maps. Orange arrows represent indicators that were calculated. |
2.3 Evapotranspiration
Evapotranspiration was estimated by the Thornthwaite method (Tw), a monthly temperature-based method that has been used for estimating evapotranspiration in previous studies for the Yucatán Peninsula (Bautista et al., 2009; Delgado et al., 2011). Tw can be used in locations where environmental data are limited and to identify monthly variations over a period of time (Bautista et al., 2009). For this study, data from CONAGUA, CFSA, and theoretical sunshine hours for each month from Allen (Allen et al., 1998) were used to estimate monthly evapotranspiration (ET0) from 1989 to 2019 according to the formula (Formula (1)) described by the Thornthwaite method (Thornthwaite, 1948).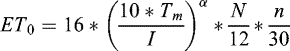 (1)
where Tm is the mean air temperature for each month (°C), I is the annual heat index
(1)
where Tm is the mean air temperature for each month (°C), I is the annual heat index  , α = 6.7512 * 10−7 * I
3 − 7.711 −10−5 * I
2 + 1.7921 * 10−2 * I + 0.49239, N are the theoretical sunshine hours for each month considering a latitude of 20° in the Northern Hemisphere (Allen et al., 1998), and n is the number of days per month.
, α = 6.7512 * 10−7 * I
3 − 7.711 −10−5 * I
2 + 1.7921 * 10−2 * I + 0.49239, N are the theoretical sunshine hours for each month considering a latitude of 20° in the Northern Hemisphere (Allen et al., 1998), and n is the number of days per month.
2.4 Estimated recharge
The aquifer recharge in Cozumel was calculated according to the following assumptions: (1) the whole UGA C1 surface contributes to recharge, (2) the whole area of UGA C1 is considered conserved and thus perturbations are not accounted for, and (3) the maximum soil moisture capacity (STC) is evenly distributed on UGA C1. Estimated recharge is considered the potential aquifer recharge, defined as the part of precipitation that infiltrates below the root zone (Pulido-Velazquez et al., 2018). It occurs when soil moisture is at the STC and monthly precipitation (Pi) exceeds monthly evapotranspiration (EToi), as stated in equation (2) (Alley, 1984; Rodríguez-Huerta et al., 2019a).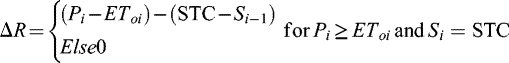 (2)where Pi represents precipitation for each month, Si the available soil moisture for each month, Si−1 is the soil moisture quantity of the previous month, and STC = 224 mm as estimated by Rodríguez-Huerta et al. (2019a) for Cozumel Island. STC is calculated by multiplying the soil available water capacity and root depth of vegetation. Recharge volume calculations started in September 1989 due to the elevated precipitation value, thus considering Si = STC for that month. Because of this, estimated recharge calculations for every month in 1989 were not possible, for which this year was not considered in the analysis. Monthly estimated recharge volumes for UGA C1 were obtained by multiplying recharge values (ΔR) by the UGA C1 area (68.85 km2).
2.5 Data analysis
2.5.1 Trend estimation
Prior to Mann-Kendall trend analysis, one of the requirements is the absence of autocorrelation in the data (Helsel and Hirsch, 2002; Modaresi et al., 2016), which occurs when observations are strongly correlated with each other between a data point and its adjacent point (Helsel and Hirsch, 2002). To identify the presence of autocorrelation, individual indicator data sets were tested for the autocorrelation coefficient (r1) by formula (3) (Shewhart and Wilks, 2016): (3)where n is the total number monthly registrations for each variable, Xi represents a value in the data series, Xi+1 represents the following value from Xi and
  is the average for the given variable.
And the 95% confidence intervals were estimated: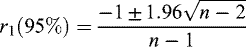 (4)
(4)
If the estimated r1 value fell between the r1 (95%) intervals, then the data were considered serially correlated (Ahmad et al., 2015).
2.5.2 Mann-Kendall test
This test has been used and recommended by the World Meteorological Organization for evaluating trends in climatic, hydrological and water resource data (Jaiswal et al., 2015). Trends allow us to visualize whether data have a tendency to increase, decrease or stay static over time and can be estimated by the nonparametric Mann-Kendall test (MKt) (Chen et al., 2015; Emeribe et al., 2019; Hussain et al., 2015). MKt is calculated by comparing for a negative or positive difference in consecutive pairs of data values in the data set, without considering the magnitude of the difference (Rosmann et al., 2016). In this study, MKt was performed on every indicator dataset for trend estimation because a normal distribution of data is not required, and outliers (such as extreme precipitation events) do not affect the result (Ahmad et al., 2015; Jaiswal et al., 2015). In this test, no trend corresponds to the null hypothesis, and a positive or negative trend corresponds to the alternate hypothesis. A Z value of 0 corresponds to no trend, a positive Z value to an increasing trend and a negative Z value to a decreasing trend (Gocic and Trajkovic, 2013). This method allows to identify the overall upward, downward or static behaviour of values from a time series. To estimate the number of positive differences minus the number of negative differences (S), the variance of S or VAR (S), and the MKt statistic (Z), equations (5)–(7) were used (Phuong et al., 2019; Rosmann et al., 2016).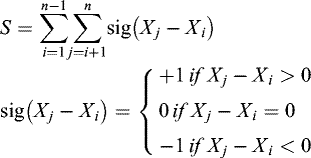 (5)
(5)
VAR (S) was estimated by equation (6),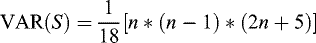 (6)
(6)
and Z was calculated with equation (7)
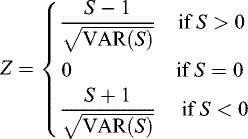 (7)where n is the total number of monthly registrations for each variable, Xi represents a value in the data series and Xj represents the following value from Xi.
Although Z value might indicate an increasing or decreasing trend, in order for it to be significant, trend test should be done at specific significance levels. For this study a 95% significance was used with a considered critical value of 1.96 for Z1−α/2 (Ahmad et al., 2015; Gocic and Trajkovic, 2013). The estimated value of Z corresponds to a significant positive or negative trend as long as the calculated value of Z is greater or lower than the interval between 1.96 and −1.96; otherwise, no significant trend is assumed (Ercan and Yüce, 2017; Yadav et al., 2014).
2.5.3 Sen's slope
To take into account the magnitude of the difference in trends, Sen's slope estimation method was used (Rosmann et al., 2016). This method pairs all the values from a time series and estimates their slope, then uses the median from these slopes to calculate an overall slope, as described by equation (8) (Hussain et al., 2015): (8)
(8)
where xj and xk are data values at times j and k (j > k), respectively. Increasing and decreasing trends correspond to positive and negative signs from the estimated slopes (Phuong et al., 2019).
2.5.4 Box plots
Boxplots are a useful and concise visual representation of a data set, providing graphical displays of the presence or absence of unusual values (outliers), skewness (relative size of box halves), variation in spread (interquartile range or box height) and centre of data (median or the centreline of the box) (Helsel and Hirsch, 2002). Boxplots were used to identify annual variations in data sets from each indicator data set (Modaresi et al., 2016; Saadat et al., 2013; Toews et al., 2007) by considering the data for each of the twelve months within the considered time period of each time series (example: all precipitation values for January from 1989 to 2019). Seasonality can be visually identified by the position of the centre from each box (median for every month), mean and median from the previous and next boxes. Seasonal values have a generalized annual cycle (Toews et al., 2007) and usually show an annual pattern with values of a similar behaviour that allows groups to be formed (Saadat et al., 2013).
2.5.5 Time series
Time series were elaborated for monthly precipitation, mean temperature, evapotranspiration, estimated recharge volume, water withdrawal and sector distributions. Extreme precipitation events are indicated by precipitation and estimated recharge time series. Time series are sequential observations over time and a valuable method to visually identify trends and the overall behaviour of data (Neeti et al., 2012).
2.6 Well status
Information about the status of CAPA wells from 2013 and 2018 is represented within maps. Based on their current status, CAPA classifies wells as (1) active, operating wells without volume and quality issues for extraction; (2) repose, temporarily out of service wells due to exceeding chloride by law levels; and (3) dejected, wells out of operation due to unfavorable water quality for extraction. This status description was based only on data provided by CAPA.
2.7 Statistical software
Time series, Seńs slope test and boxplots were elaborated and estimated by the software MINITAB vs. 18.
Maps were drawn using Geographic Information System software QGIS vs. 3.12.
3 Results
Cozumel is a karstic island that was formed by the uplift of the seabed (Spaw, 1978); thus, few slopes and a low maximum altitude are present. A microbasin has formed naturally in the north-centre due to small elevations (4–5 m) and slightly higher elevation (7.5–11 m) in the far north and along the perimeter of the coastline in the east (Fig. 1) (Frausto-Martínez et al., 2019). Due to the low elevation on the island, most of the rainwater can infiltrate to the porous medium, or through sinkholes. On average, the island has 0.01% of gradient which is a consequence of the high transmissivity produced by high karstification (Sánchez y Pinto et al., 2015). These characteristics favour the channeling, storage and infiltration of rainwater in the north-central zone where UGA C1 is located, in addition to being the location of the greatest freshwater lens on the island. However, high permeability of karstic systems also increases vulnerability to pollutant infiltration and does not prevent issues from over extraction like seawater intrusions (Medici et al., 2019, 2020).
3.1 Trend analysis
Descriptive statistics for all considered indicators are shown in Table 1. The result of the autocorrelation function (ri) estimated that none of the analysed indicators had autocorrelation and therefore were suited for the Mann–Kendall trend test.
The results for Z show statistically increasing trends for monthly temperature, evapotranspiration, extracted water, commercial, and general services, while a statistically decreasing trend was found for precipitation, estimated UGA C1 recharge, and industry. Although a significant trend was not found for domestic (Z = –0.59) and hotels (Z = –0.71), a slight negative trend was found for both indicators in their trend magnitude (–12.87 and −9.31, respectively) (Tab. 2).
Descriptive statistics and results for the autocorrelation function (r1) (α = 0.05).
Results from MKt and Seńs slope. Estimated trends are significant with an α = 0.05.
3.2 Seasonality
Seasonality was observed in precipitation values, where the mean peak values were identified from September through November and lower values were identified from February and March (Fig. 3a). For mean temperature and evapotranspiration, mean peak values were in July and August (Fig. 3b, c). The estimated recharge in UGA C1 showed October and November as the months with the greatest mean values and outliers. A slight seasonal increasing effect of water consumption was observed in the first three months for commercial services, general services and hotels.
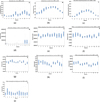 |
Fig. 3 Monthly annual variations in each indicator within their analysed time period. |
3.3 Precipitation and temperature
A sudden increase in mean temperature can be observed in the last 8 years. In July 2012, a monthly mean temperature of 30 °C was recorded for the first time in the analysed period, but the highest environmental temperature of 32.5 °C were recorded in 2016 and 2017. Since 2013, the highest records remain over 30 °C on Cozumel Island (Fig. 4b). Extreme precipitation events on October 1998, 1999, 2005, and 2011 correspond temporally to hurricanes Mitch, Katrina, Wilma and Rina, respectively.
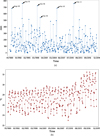 |
Fig. 4 Monthly precipitation (a) and mean temperature (b) registered in Cozumel from 1989 to 2019. |
3.4 Evapotranspiration
Evapotranspiration calculated by the Thornthwaite method is based on monthly temperature values, so a behavior similar to that in mean monthly temperature is expected. Evapotranspiration showed a mean monthly value of 164.6 mm (Tab. 1) and an increasing trend with a slope magnitude of 0.159. In Cozumel, few studies have reported evapotranspiration values, some of which estimate evapotranspiration to be up to a 75% of yearly precipitation (Wurl et al., 2003), and others as much as 568.73 Mm3/year when estimated by the Turk method (CONAGUA, 2015). An increase in values from July 2012 can be observed, reaching its maximum in July 2017, with a value of 380 mm (Fig. 5).
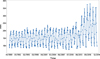 |
Fig. 5 Estimated Evapotranspiration from 1989 to 2019. |
3.5 Estimated recharge
An increasing trend for the frequency of hurricanes and tropical storms in the Caribbean is expected for the next years (Taylor et al., 2012). There appears to be a relation between recharge and extreme precipitation events, as seen in Figure 6. Although hurricanes and tropical storms are associated with an important increase in precipitation volumes (Vosper et al., 2020), the volume of rainfall contributed seems to depend on the behavior, characteristics and intensity of the climatic event. The results from Figure 6 show a reduction in the contribution of tropical storms and hurricanes to the estimated recharge volume in the last two decades compared to 1990s. Partly because rain is not the only factor that influences, recharge is the set of several factors, such as aquifer geological composition, soil storage capacity, and evapotranspiration.
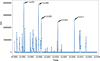 |
Fig. 6 Estimated aquifer recharge for Cozumel from 1990 to 2019. |
3.6 Water extraction from UGA C1 and consumption by sector
The increased extraction volumes from wells are related to population growth and economic development on the island in the last 30 years, as economic growth and urbanization raise the demand for water (Rodríguez-Huerta et al., 2019b). The average monthly extraction volume was 345,807 m3 (Tab. 1), with the highest volume (436,806 m3) recorded in October 2015, followed by a decrease in extraction volumes (Fig. 7). The number of people living on the island in 2005 was 73,193 (Ayuntamiento Presidencia Municipal Cozumel, 2015) while in 2017 it was 93,477 (SEDETUS, 2019); therefore, the annual population growth rate for that period of time was 2.1%. Individual water consumption graphs on Fig. S1: for commercial use, Fig. S2: general services, Fig. S3: industry, Fig. S4: hotels, and Fig. S5: domestic can be consulted as Supplementary material.
Special attention should be paid to the difference in the total volume of water extracted and the sum of consumed water by all sectors from 2005 to 2018. This difference resulted in a mean monthly volume of 1,098,000 ± 352,329 m3, which represents an average 26% of the total extracted volume from wells for the estimated time period. Part of this missing water volume might be attributed to leaks due to deficiencies in the distribution infrastructure. Water leaks are a serious problem in many places, some of which represent 37% of the total distributed volume for Mexico city (CEMDA, 2006) or up to 15% for some parts of the United States (Raei et al., 2019).
According to information from this study, a total of 58,095,509 m3 of water was extracted from CAPA wells, and a total of 139,570,864 m3 were estimated as recharge for UGA C1 from 2005 to 2018, meaning that for that period, 41.6% of the recharged water volume was extracted from UGA C1 by CAPA. It should be noted that this represents only the extracted volume from wells and aquifer volume reductions by evapotranspiration and underground springs should be considered on further studies.
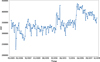 |
Fig. 7 Monthly water extraction volume from CAPA wells from 2005–2018. |
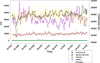 |
Fig. 8 Monthly water consumption from different sectors from 2005–2018. The secondary axis corresponds to the domestic water consumption volume. |
3.7 Status of wells
The status of wells from CAPA in UGA C1 is deteriorating (Fig. 9a and b) as can be seen by an increase in the status of dejected (from 31 to 55) and the status of repose (from 34 to 47) wells from 2013 to 2018. Within analyzed time period, dejected wells increased in the extreme south-east, as well as in the extreme northeast of the UGA C1. On the other hand, deposed wells increased mainly within the area near the center of the UGA C1, surrounding the highway. In order to remedy well deterioration, important active strategies must be developed to reestablish the freshwater lens in each well (Zepeda et al., 2018).
Current information about well status is based only on information provided by CAPA; thus, further field research to confirm the actual status of wells must be performed. On the island, well infrastructure may be vandalized resulting in removed supplies such as electrical cables and water pumps or direct damage to distribution pipes within the UGA C1. In addition, the lack of maintenance on the roads to the wells can difficult well water sampling due to vegetation overgrowth. These infrastructure situations should be considered to complement the current water quality-based status of wells, in order to develop more integrative maps from the current state of the wells within the UGA C1.
4 Discussion
Elevated indicator values (>1) of kurtosis and skewness from precipitation and estimated recharge were observed in Table 1. Although most of the analyzed months registered some precipitation volumes, the majority of them were close to cero. Similar to what happened with precipitation, estimated recharge would not occur with low rainfall volumes, which resulted in the clustering most of the indicator values in cero o close to cero due to the low number of recharge events. This influenced data distribution of indicator values resulting in elevated kurtosis and skewness values.
4.1 Climate trends
On Cozumel, the low terrain elevation (4–5 m) surrounded by slightly higher elevations (7.5–11 m) structures a naturally formed basin (Frausto-Martínez et al., 2019). Water infiltration is enhanced by the geohydrological setting, allows the presence of one aquifer within this basin. Similar structure, and geologic characteristics can be identified on Caribbean islands, such as western Cuba, north-central Jamaica and northwestern Puerto Rico (Doerr and Hoy, 1957), where the geohydrology allows the maintenance of an aquifer.
The aquifers of these Caribbean karst islands are also subject to high vulnerability, where water supply and drought are considered major sustainability issues (Day, 2010; Len and Parise, 2009). To address them, the complexity and particularities of each groundwater system needs to be considered for their adequate management (Kačaroğlu, 1999). Although the analysis of hydro meteorological dynamics is vital due to precipitation being the main source of recharge for these aquifers. Therefore, trend analysis of information from the past years is a resourceful way to understand the behavior of the indicators and their current situation, as the basis for the development and update of water management strategies. The analysis presented on this study could be used to complement water management studies on islands with similar geohydrological settings, where hydro meteorological information may be scarce.
The seasonality allows to identify yearly patterns within an indicator data set. Seasonality, as seen on Figure 3a and b, for precipitation and temperature correspond with literature reports for both rainy and dry tropical seasons (SECTUR, 2018). The monthly average precipitation was 142 mm (Tab. 1), and total monthly precipitation showed decreasing trend (Z = –2.78). Because rain is the only source of fresh water to Caribbean karstic aquifers, a decrease in its volume directly impacts recharge volumes. When compared to previous years, a remarkable decrease of intense precipitation events from October 2011 to December 2019 (Fig. 4a) can be identified. Even though an increase in hurricanes and tropical storms is expected due to climate change in the Caribbean (Vosper et al., 2020), their effect on intense precipitation volumes in Cozumel has yet to be studied. Most of the available hydro meteorological trend studies do not focus on Cozumel but are meant for the Yucatan Peninsula area. These studies suggest an overall regional decreasing trend in precipitation (Castro-Borges and Mendoza-Rangel, 2010; De la Barreda et al., 2020; Rodríguez-Huerta et al., 2019b), although there is evidence of an increase in some locations of the Yucatan Peninsula, such as Ria Lagartos (Yucatan State) and Escárcega (Campeche State) (Neeti et al., 2012). This information suggests that despite the expected regional decreasing trend in precipitation, there may be a different precipitation behaviour on a local scale, thereby emphasizing the importance of specific studies for areas such as Cozumel.
Previous studies indicate that small islands do not have the sufficient conditions to create their own weather as continents do, which makes them particularly vulnerable to changing weather conditions (Gamble, 2004). The variation on hydro meteorological indicators could affect water availability on islands of the Caribbean, due to the dependence of rainwater infiltration dynamics for aquifer recharge (Falkland, 1993). For the Caribbean, climate projections estimate a 0.7–4 °C temperature increase and a 10–30% precipitation decrease, although these variations are not expected to be homogeneous, with differences within the region according to time and location (Cashman, 2014). Therefore, there is a need to identify changes and update the dynamics of the variables associated with aquifer recharge, as they are the basis for estimating other indicators for the sustainable management such as aquifer volume and aquifer safe yield.
An increasing trend on monthly temperature was observed (Tab. 2): at present, CONAGUA reports an average annual temperature of 24.7 °C for Cozumel (CONAGUA, 2015), monthly temperature analysed here showed a mean value of 27.5 °C (Tab. 1); although the results from Sen's Slope test show a minimum magnitude increase, an important increase in monthly temperatures can be seen starting from July to September (2012) and follow through next seven years. Because Sen's slope was estimated for the monthly 30-year period, this increase might not be reflected in the magnitude. The rising mean temperature fits reports from previous studies where an increase in temperature for the Yucatan Peninsula and the Caribbean was predicted and identified (Castro-Borges and Mendoza-Rangel, 2010; De la Barreda et al., 2020; Rodríguez-Huerta et al., 2019a).
In Mexico, the modification of precipitation and temperature patterns due to climate change is expected (De la Barreda et al., 2020), although weather variations in the Caribbean can also be associated to “el niño” and “la niña” (Reguero et al., 2013). Due to this variability, uncertainty in possible future outcomes is expected; therefore constant monthly monitoring and information analysis for detailed water balance studies on islands is needed (Falkland, 1993).
Studies have reported that an increase in evapotranspiration and a decrease in precipitation are associated with a decrease in vegetation (Dinpashoh et al., 2011). Further studies are encouraged to evaluate the fluctuations in evapotranspiration values and their effect on vegetation density or variety on the island.
4.2 Recharge and economic issues
Previous estimations of recharge volumes have been made for the island, although they vary due to the considered surface for infiltration. CONAGUA estimated 208,070,000 m3 of recharge in 2015 and 2020 considering the whole island as an infiltration surface (CONAGUA, 2015; DOF, 2020), while other researchers estimated a volume of 47,500,000 m3 for the catchment and southwest areas (Koch et al., 2016). In another study, a volume of approximately 140 × 106 m3/year was estimated by a 0.2 infiltration coefficient from total yearly rainfall (Lesser et al., 1978), while other authors established that annual recharge is only 6% of yearly precipitation volume (Wurl et al., 2003). Although all these reports are important, it represents a challenge to compare the information between the different studies, since in these cases, there is not a full description of the considered precipitation period, the criteria considered for calculating the recharge and the surface area of infiltration. For this study, only the surface area of UGA C1 was considered, and a monthly mean estimated recharge volume of 1,482,705 m3 was calculated from 1990–2019 (Tab. 1) with a downward trend (Z = –2.938), as seen in Table 2.
Results from Figure 3 suggest a synchronism between intense precipitation events and high estimated recharge as most of the estimated recharge volumes happen in October and November, concurring with the highest precipitation months (September to November). As in Cozumel high-volume precipitation events begin on September, soils become saturated with water that exceeds evapotranspiration volumes. The geohydrological characteristics of Cozumel favor an absence of runoff, enhancing the aquifer estimated recharge in the following months which decreases as the rainy season ends. When homologating estimate recharge calculations for other islands with similar geohydrological settings, local conditions, regional indicator values and soil moisture capacity adjustments must be considered.
According to Figure 6, there seems to be a reduction in the number of months when recharge occurs. Out of a total of 120 months per decade, the sum of months in which recharge has occurred shows a decrease: 32 for the 1990s, 10 for the 2000s, and 9 from 2011 to 2019. The decrease in estimated recharge could be linked partly to a decreasing trend in precipitation and an increase in evapotranspiration from the past 8–10 years, when a greater volume of evaporation and water uptake by plants reduces available water for aquifer recharge. For the Yucatan Peninsula, data analysis has shown possible multiannual cyclical patterns of ∼10 years for atmospheric parameters (Castro-Borges and Mendoza-Rangel, 2010). Further research on larger time scales and different time periods (example: 10 years) should be performed to identify patterns or cycles among precipitation, temperature, other indicators and their effect on evapotranspiration and recharge for Cozumel.
An increasing trend of water extraction volumes from wells in UGA C1 was observed in Figure 7, along with an important reduction in the quality of wells from 2013–2018 (Fig. 9a and b). Together with an increase in evapotranspiration, these results might indicate a depletion in the freshwater lens of Cozumel. A reduction of the hydraulic head in aquifers can be linked to the overexploitation of groundwater and elevated evapotranspiration/precipitation ratios, resulting in saltwater intrusions (Villasuso et al., 2011). Therefore, management of the aquifer in Cozumel should consider updated safe extraction yields that are frequently estimated and readjusted to prevent unsustainable water withdrawals from wells, due to the observed variation in hydrometeorological indicators that have an effect over infiltration and aquifer available volumes (Cashman, 2014; Ng et al., 1992).
Cozumel's economy is founded on tourism, water consumption patterns are expected to be influenced by visitors during the called “high and low” touristic seasons. This was observed on the seasonality results for commercial and hotel water use (Fig. 3f and i respectively), as a mean increase of consumption in high season (summer and winter) and a decrease in low season (September and October) (Segrado et al., 2017). On the other hand, due to the lack of industrial development, no visible seasonality was identified in the use of water for this.
An overall increase in tourism activities might also explain the increasing trend in water consumption by the commercial sector and the decreasing trend by the industry sector. A similar trend has been reported in the State of Quintana Roo, where an increase in consumption in the service sector was caused by tourism economic growth (Rodríguez-Huerta et al., 2019b). The domestic sector does not show an increasing trend over time according to the MKt as would be expected for an increasing population on the island.
Although reductions in distribution service hours have been reported by the population (unpublished data), the absence of a trend on domestic use might also be attributed to the practice of digging domestic wells for water necessities in urban areas or where public water distribution services are not available (Koch et al., 2016). By doing so, inhabitants obtain access to the freshwater lens to partially or completely fulfil their water necessities (except for drinking), thus substituting CAPA water distribution services. It should be noted that in Mexico is mandatory to obtain an approved concession title for water exploitation from the Public Registry of Water Rights (REPDA) and CONAGUA prior to the creation of new wells. Only users subscribed to REPDA may legally extract water within Mexican territory, and although there is a record of the maximum allowed extraction volume per user, there is no information on the actual extracted volume. Additionally, the use of water directly from wells is not recommended due to poor water quality implications unless it has gone through a proper purification process prior to its use.
In Cozumel, there is a popular belief that tourism is an important contributor to freshwater consumption, although this has not been supported by the evidence analyzed here. The results from Figure 8 and Table 2 show that the domestic monthly averaged consumption volume from water distributed by CAPA is 5.8 times greater than the mean monthly hotel sector consumed volume and 4.8 times greater than the mean monthly commercial consumption volume. This evidence positions the domestic sector as the greatest consumer by volume of water extracted from UGA C1, with a mean monthly volume of 177,105 m3. It has been stated that tourists use considerably more water than locals (up to a factor of 10 times), and this effect seems to be exacerbated in developing countries (Becken, 2014). Although no evidence of this effect was found in this study, more research that considers the particularities of the economic activity and environmental resources of Cozumel is encouraged. On other islands like Barbados and Trinidad and Tobago, water demand by domestic sector can account for up to 31 and 40% of the total demand by sector (Ekwue, 2010). Further studies must consider not only the water volumes distributed by CAPA but also water volumes extracted directly from the aquifer by users with REPDA concessions registered for the island, such as hotels that do not receive water services from CAPA. The smallest consumer of water on the island is the industrial sector, with a mean monthly volume of 167.67 m3.
5 Conclusions
On the island, a static behavior of hydrometeorological and hydrological indicators can be misinterpreted, as reports (if present) for these indicators are often times not updated, non-consecutive, and not monthly based. The results from this study show significant trends in hydrometeorological indicators, estimated recharge, water extraction and most of the volumes distributed to sectors on the island by CAPA. This is evidence to corroborate the hypothesis of a dynamic behaviour of these indicators when analyzed on a continuous monthly basis, thus encouraging their constant future monitoring
Overall, the results show an increasing trend for mean monthly temperature, evapotranspiration, water extracted from wells, and water consumption by general services and commercial sectors, along with a decreasing trend for precipitation, estimated recharge and water consumed by industry. The MKt did not estimate a significant trend for the domestic and hotel sectors. Estimated recharge volumes showed an important volume increase from extreme precipitation events such as hurricanes and tropical storms. The greatest water consumer by volume was the domestic sector, while industry was the sector that consumed the least. An increase in dejected (77%) and reposed (38%) wells within the catchment area was observed. Hydrometeorological trend evidence, extraction volumes, consumption by the commercial sector, and the deterioration of the state of the wells suggest increasing pressure on the aquifer in UGA C1 from Cozumel in the past 30 years. Monthly analysis of hydrometeorological and hydrological indicators is highly recommended as part of a monitoring framework for island water management strategies development and update, and could be implemented on Caribbean islands with a similar geohydrological setting, where water resources are highly vulnerable and a major sustainability concern. Analysis performed in this study could be suited for karstic Islands where hydrometeorological information is not fully available, in order to improve sustainable aquifer management strategies. Due to the uncertainties of the particular effects on islands from climate change on precipitation and temperature, there is a need to understand the dynamic of indicators related to island aquifer recharge and the demand from users as a basis for an adequate water management. For an adequate water management on islands, information from different sources related to the aquifer should be examined and analized to enhance an integrative approach. As available freshwater volumes decrease and quality deteriorates, indicator analysis updates become an important tool for making adequate management decisions that contribute to resource sustainability.
Supplementary Material
Supplementary file supplied by the authors. Access Supplementary Material
Acknowledgments
The authors thank to Universidad de Quintana Roo and Instituto Potosino de Investigación Científica y Tecnológica, A. C. (IPICYT). We thank to CAPA for the accessibility and cooperation, specially to Vlady Vivas Vivas and Gerardo Téllez Díaz. Consejo Nacional de Ciencia y Tecnología (CONACYT) for scholarship No. 483462 to G. H-F.
References
- Ahmad I, Tang D, Wang T, Wang M, Wagan B. 2015. Precipitation trends over time using Mann-Kendall and spearman's Rho tests in swat river basin, Pakistan. Adv Meteorol 15. [Google Scholar]
- Allen RG, Pereira LS, Raes D, Smith M. 1998. FAO Irrigation and Drainage Paper No. 56 − Crop Evapotranspiration, FAO, Rome, p. 300. [Google Scholar]
- Alley WM. 1984. On the treatment of evapotranspiration, soil moisture accounting, and aquifer recharge in monthly water balance models. Water Resour Res 20: 1137–1149. [CrossRef] [Google Scholar]
- Ayuntamiento Presidencia Municipal Cozumel. 2015. Programa parcial de desarrollo urbano de la zona 1 de Cozumel, Quintana Roo. In Diario Oficial del Estado de Quintana Roo, Gobierno de Quintana Roo, Chetumal, p. 135. [Google Scholar]
- Bautista F, Bautista D, Delgado-Carranza C. 2009. Calibration of the equations of Hargreaves and Thornthwaite to estimate the potential evapotranspiration in semi-arid and subhumid tropical climates for regional applications. Atmosfera 22: 331–348. [Google Scholar]
- Bautista F, Palacio-Aponte G, Quintana P, Zinck JA. 2011. Spatial distribution and development of soils in tropical karst areas from the Peninsula of Yucatan, Mexico. Geomorphology 135: 308–321. [CrossRef] [Google Scholar]
- Becken S. 2014. Water equity − contrasting tourism water use with that of the local community. Water Resour Ind 7–8: 9–22. [CrossRef] [Google Scholar]
- Cashman A. 2014. Water security and services in the Caribbean. Water 6: 1187–1203. [CrossRef] [Google Scholar]
- Castro-Borges, Mendoza-Rangel JM. 2010. Influence of climate change on concrete durability in Yucatan Peninsula. Corros Eng Sci Technol 45: 61–69. [CrossRef] [Google Scholar]
- CEMDA, (Centro Mexicano de Derecho Ambiental A.C.). 2006. El agua en México: lo que todas y todos debemos saber, Centro Mexicano de Derecho Ambiental, Ciudad de México, p. 93. [Google Scholar]
- Chen W, Chen C, Li L, Xing L, Huang G, Wu C. 2015. Spatiotemporal analysis of extreme hourly precipitation patterns in Hainan Island, South China. Water 7: 2239–2253. [CrossRef] [Google Scholar]
- CONAGUA, (Comisión Nacional del Agua). 2015. Actualización de la disponibilidad media anual de agua en el acuífero Isla de Cozumel (2305), Diario Oficial de la Federación, Ciudad de México, p. 22. [Google Scholar]
- Day M. 2010. Challenges to sustainability in the Caribbean karst. Geol Croat 63: 149–154. [Google Scholar]
- De la Barreda B, Metcalfe SE, Boyd DS. 2020. Precipitation regionalization, anomalies and drought occurrence in the Yucatan Peninsula, Mexico. Int J Climatol 40: 4541–4555. [CrossRef] [Google Scholar]
- Delgado CC, Bautista F, Orellana LR, Reyes HH. 2011. Classification and agroclimatic zoning using the relationship between precipitation and evapotranspiration in the state of Yucatán, Mexico. Investig Geogr 75: 51–60. [Google Scholar]
- Deng Y, Young C, Fu X, Song J, Peng ZR. 2017. The integrated impacts of human activities and rising sea level on the saltwater intrusion in the east coast of the Yucatan Peninsula, Mexico. Nat Hazards 85: 1063–1088. [CrossRef] [Google Scholar]
- Dinpashoh Y, Jhajharia D, Fakheri-Fard A, Singh VP, Kahya E. 2011. Trends in reference crop evapotranspiration over Iran. J Hydrol 399: 422–433. [CrossRef] [Google Scholar]
- Doerr A, Hoy D. 1957. Karst landscapes of Cuba, Puerto Rico, and Jamaica. Sci Mon 85: 178–187. [Google Scholar]
- DOF, (Diario Oficial de la Federación). 2020. ACUERDO por el que se actualiza la disponibilidad media anual de agua subterránea de los 653 acuíferos de los Estados Unidos Mexicanos, mismos que forman parte de las regiones hidrológico-administrativas que se indican, Diario Oficial de la Federación, Ciudad de México. [Google Scholar]
- Ducci D, Sellerino M. 2013. Vulnerability mapping of groundwater contamination based on 3D lithostratigraphical models of porous aquifers. Sci Total Environ 447: 315–322. [CrossRef] [PubMed] [Google Scholar]
- Ekwue EI. 2010. Management of water demand in the caribbean region: current practices and future needs. West Indian J Eng 32: 28–35. [Google Scholar]
- Emeribe C, Butu A, Laka S. 2019. Trend analysis, cycles and periodicities in annual maximum daily rainfall distributions over Southern Nigeria. J Niger Assoc Math Phys 52: 299–312. [Google Scholar]
- Ercan B, Yüce MI. 2017. Trend analysis of hydro-meteorological variables of Kızılırmak Basin. Nevşehir Bilim ve Teknol Derg Cilt 6: 333–340. [CrossRef] [Google Scholar]
- Escalante P. 1996. Tipos de vegetación de la Isla de Cozumel, Quintana Roo, scale 1:5. In: Proyecto B010 Avifauna de la Isla de Cozumel, Universidad Autónoma de México, Instituto de Biología and Departamento de Zoología, Ciudad de México. [Google Scholar]
- Escolero O, Marín L, Steinich B, Pacheco J, Anzaldo J. 2005. Geochemistry of the hydrogeological reserve of Mérida, Yucatán, Mexico. Geofis Int 44: 301–314. [Google Scholar]
- Falkland A. 1993. Hydrology and water management on small tropical islands. Hydrol warm humid Reg 126: 263–303. [Google Scholar]
- Flores-Delgadillo L, Fedick S, Solleiro-Rebolledo E, Palacios-Mayorga S, Ortega-Larrocea P, Sedov S, Osuna-Ceja E. 2011. A sustainable system of a traditional precision agriculture in a Maya homegarden: soil quality aspects. Soil Tillage Res 113: 112–120. [CrossRef] [Google Scholar]
- Frausto-Martínez O, Gutiérrez-Aguirre MA, Cervantes-Martínez A, Mejía-Ortíz LM, Yañez G, Koch HC, Vázquez AB, Hernández-Flores G, Colín O, Salazar AS, Giese S. 2018. Estudio hidrológico de la isla de Cozumel, Universidad de Quintana Roo, Cozumel, p. 105. [Google Scholar]
- Frausto-Martínez O, Zapi-Salazar N, Colin-Olivares O. 2019. Identification of Karst Forms Using LiDAR Technology: Cozumel Island, Mexico. In Abdalla R. (Ed.), Trends in Geomatics, An Earth Science Perspective, Intechopen. [Google Scholar]
- Gamble D. 2004. Water resource development on small carbonate islands: solutions offered by the hydrologic landscape concept. In: Janelle D, Warf B, Hansen K, Sprague B, Zavala G, (Eds.), WorldMinds: Geographical Perspectives on 100 Problems. Norwell: Kluwer Academic Publishers, pp. 503– 507. [CrossRef] [Google Scholar]
- García-Gómez AG, Castaño-Meneses G, Vázquez-González MM, Palacios-Vargas JG. 2014. Mesofaunal arthropod diversity in shrub mangrove litter of Cozumel Island, Quintana Roo, México. Appl Soil Ecol 83: 44–50. [CrossRef] [Google Scholar]
- Gocic M, Trajkovic S. 2013. Analysis of changes in meteorological variables using Mann-Kendall and Sen's slope estimator statistical tests in Serbia. Glob Planet Change 100: 172–182. [CrossRef] [Google Scholar]
- Gompper ME, Petrites AE, Lyman RL. 2006. Cozumel Island fox (Urocyon sp.) dwarfism and possible divergence history based on subfossil bones. J Zool 270: 72–77. [Google Scholar]
- González PD, Martín MJ, Guaita MJ, Sáez-Fernández J. 2020. An analysis of the cost of water supply linked to the tourism industry. An application to the case of the Island of Ibiza in Spain. Water 12. [Google Scholar]
- Gutiérrez-Aguirre MA, Cervantes-Martínez A, Coronado-Álvarez L. 2008. Limnology of groundwater exposures with urban influence in Cozumel island, Mexico. Verh Internat Verein Limnol 30: 493–496. [Google Scholar]
- GWP, (Global Water Partnership). 2014. Technical Focus Paper − Integrated water resources management in the Caribbean: The challenges facing Small Island Developing States, Global Water Partnership, Sweden, p. 52. [Google Scholar]
- Hall T, Sealy AM, Stephenson TS, Kusunoki S, Taylor MA, Chen AA, Kitoh A. 2013. Future climate of the Caribbean from a super-high-resolution atmospheric general circulation model. Theor Appl Climatol 113: 271–287. [CrossRef] [Google Scholar]
- Helsel DR, Hirsch RM. 2002. Statistical methods in water resources. US Geological Service, Reston, p. 510. [Google Scholar]
- Hernández-Flores G, Gutiérrez-Aguirre MA, Cervantes-Martínez A. 2020. Hacia un manejo integral del recurso hídrico en isla Cozumel, Quintana Roo. Impluvium 10: 34–40. [Google Scholar]
- Hernández-Terrones L, Rebolledo-Vieyra M, Merino-Ibarra M, Soto M, Le-Cossec A, Monroy-Ríos E. 2011. Groundwater pollution in a karstic region (NE Yucatan): Baseline nutrient content and flux to coastal ecosystems. Water Air Soil Pollut 218: 517–528. [CrossRef] [Google Scholar]
- Herrera-Silveira JA, Medina-Gomez I, Aranda-Cirerol N, Zaldivar A, Ramirez J, Trejo J. 2002. Trophic status in coastal waters of the Yucatan Peninsula (SE, Mexico) using water quality indicators. Coast Environ Environ 8: 351–359. [Google Scholar]
- Holden J, Grayson RP, Berdeni D, Bird S, Chapman PJ, Edmondson JL, Firbank LG, Helgason T, Hodson ME, Hunt SFP, Jones DT, Lappage MG, Marshall-Harries E, Nelson M, Prendergast-Miller M, Shaw H, Wade RN, Leake JR. 2019. The role of hedgerows in soil functioning within agricultural landscapes. Agric Ecosyst Environ 273: 1–12. [CrossRef] [Google Scholar]
- Hussain F, Nabi G, Waseem M. 2015. Rainfall trend analysis by using the Mann-Kendall test & Sen's slope estimates: a case study of District Chakwal Rain Gauge, Barani Area, Northem Punjab Province, Pakistan. Sci Int 27: 3159–3165. [Google Scholar]
- INEGI, (Instituto Nacional de Estadística y Geografía). 2013. Conjunto de datos vectoriales edafológicos, escala 1:250 000 F16-11. Instituto Nacional de Estadística y Geografía, Aguascalientes. [Google Scholar]
- Jaiswal R, Lohani A, Tiwari H. 2015. Statistical analysis for change detection and trend assessment in climatological parameters. Environ Process 2: 729–749. [CrossRef] [Google Scholar]
- Jaleel MI, Ibrahim SA, Hussain A, Mustafa M, Pathirana A. 2020. A screening approach for assessing groundwater quality for consumption in small Islands: case study of 45 Inhabited Islands in the Maldives. Water 12: 2209. [CrossRef] [Google Scholar]
- Kačaroğlu F. 1999. Review of groundwater pollution and protection in karst areas. Water Air Soil Pollut 113: 337–356. [CrossRef] [Google Scholar]
- Kammoun S, Trabelsi R, Re V, Zouari K. 2021. Coastal aquifer salinization in semi-arid regions: the case of grombalia (Tunisia). Water 13. [Google Scholar]
- Koch K, Frausto O, Giese S, Schirmer M, Steenbeck T. 2016. Impact on groundwater of a karstic aquifer in the informal settlement ‘Las Fincas’ on Cozumel Island, Mexico. WIT Trans Ecol Environ 203: 147–158. [CrossRef] [Google Scholar]
- Len L, Parise M. 2009. Managing environmental problems in Cuban karstic aquifers. Environ Geol 58: 275–283. [CrossRef] [Google Scholar]
- Lesser JH, Azpeitia RJ, Lesser JM. 1978. Geohidrología de la isla de Cozumel, Q. Roo. Recur Hidráulicos 7: 32–49. [Google Scholar]
- Medici G, Baják P, West L, Chapman P, Banwart S. 2020. DOC and nitrate fluxes from farmland; impact on a dolostone aquifer KCZ. J Hydrol 125658. [Google Scholar]
- Medici G, Engdahl NB, Langman JB. 2021. A basin-scale groundwater flow model of the Columbia plateau regional aquifer system in the Palouse (USA): insights for aquifer vulnerability assessment. Int J Environ Res 15: 299–312. [CrossRef] [Google Scholar]
- Medici G, West L, Banwart S. 2019. Groundwater flow velocities in a fractured carbonate aquifer-type: implications for contaminant transport. J Contam Hydrol 222: 1–16. [CrossRef] [PubMed] [Google Scholar]
- Mendoza-Vizcaino J, Sumper A, Sudria-Andreu A, Ramirez JM. 2016. Renewable technologies for generation systems in islands and their application to Cozumel Island, Mexico. Renew Sustain Energy Rev 64: 348–361. [CrossRef] [Google Scholar]
- Modaresi. RA, Khalili D, Kamgar-Haghighi AA, Zand-Parsa S, Banimahd SA. 2016. Assessment of seasonal characteristics of streamflow droughts under semiarid conditions. Nat Hazards 82: 1541–1564. [CrossRef] [Google Scholar]
- Neeti N, Rogan J, Christman Z, Eastman JR, Millones M, Schneider L, Nickl E, Schmook B, Turner BL, Ghimire B. 2012. Mapping seasonal trends in vegetation using AVHRR-NDVI time series in the Yucatán Peninsula, Mexico. Remote Sens Lett 3: 433–442. [CrossRef] [Google Scholar]
- Ng K-C, Jones B, Beswick R. 1992. Hydrogeology of Grand Cayman, British West Indies: a karstic dolostone aquifer. J Hydrol 134: 273–295. [CrossRef] [Google Scholar]
- Nwogu EC, Iwueze IS, Nlebedim VU. 2016. Some tests for seasonality in time series data. J Mod Appl Stat Methods 15: 382–399. [CrossRef] [Google Scholar]
- Orellana R, Nava F, Espadas C. 2007. El clima de Cozumel y la Riviera Maya. In: Mejía-Ortíz LM. (Ed.) Biodiversidad acuática de la Isla de Cozumel, Universidad de Quintana Roo − Plaza y Valdéz, México, 23–32. [Google Scholar]
- Phuong DND, Linh VT, Nhat TT, Dung HM, Loi NK. 2019. Spatiotemporal variability of annual and seasonal rainfall time series in Ho Chi Minh city, Vietnam. J Water Clim Chang 10: 658–670. [CrossRef] [Google Scholar]
- Pulido-Velazquez D, Collados-Lara AJ, Alcalá FJ. 2018. Assessing impacts of future potential climate change scenarios on aquifer recharge in continental Spain. J Hydrol 567: 803–819. [CrossRef] [Google Scholar]
- Raei E, Shafiee ME, Nikoo MR, Berglund E. 2019. Placing an ensemble of pressure sensors for leak detection in water distribution networks under measurement uncertainty. J Hydroinformatics 21: 223–239. [CrossRef] [Google Scholar]
- Reguero B, Méndez F, Losada I. 2013. Variability of multivariate wave climate in Latin America and the Caribbean. Glob Planet Change 100: 70–84. [CrossRef] [Google Scholar]
- Richards HG. 1937. Land and freshwater Mollusks from the Island of Cozumel, Mexico, and their bearing on the geological history of the region. Proc Am Philos Soc 77: 249–262. [Google Scholar]
- Rodríguez-Huerta E, Rosas-Casals M, Hernández-Terrones LM. 2019a. Water societal metabolism in the Yucatan Peninsula. The impact of climate change on the recharge of groundwater by 2030. J Clean Prod 235: 272–287. [CrossRef] [Google Scholar]
- Rodríguez-Huerta E, Rosas-Casals M, Hernández-Terrones LM. 2019b. A water balance model to estimate climate change impact on groundwater recharge in Yucatan Peninsula, Mexico. Hydrol Sci J 65: 470–486. [CrossRef] [Google Scholar]
- Rosmann T, Domínguez E, Chavarro J. 2016. Comparing trends in hydrometeorological average and extreme data sets around the world at different time scales. J Hydrol Reg Stud 5: 200–212. [CrossRef] [Google Scholar]
- Saadat S, Khalili D, Kamgar-Haghighi AA, Zand-Parsa S. 2013. Investigation of spatio-temporal patterns of seasonal streamflow droughts in a semi-arid region. Nat Hazards 69: 1697–1720. [CrossRef] [Google Scholar]
- Sánchez y Pinto I, Cervantes-Martínez A, González HR, Vázquez CM, Gutiérrez-Aguirre M. 2015. Evidencia de flujo preferencial al mar, del cenote Caletita, en Cozumel, México. Ingeniería 19: 1–12. [Google Scholar]
- SECTUR, (Secretaría de Turismo). 2018. Programa Marco para fomentar acciones para restablecer el balance del ciclo del agua en Cozumel, Secretaría de Turismo, Ciudad de México, p. 85. [Google Scholar]
- SEDETUS, (Secretaría de Desarrollo Territorial Urbano Sustentable). 2019. Programa Estatal de Ordenamiento Territorial y Desarrollo Urbano Sustentable de Quintana Roo, Quintana Roo, p. 465. [Google Scholar]
- Segrado PR, Arroyo AL, Amador SK, Farmer F. 2017. Motivational factors for tourists who choose Cozumel, Mexico, as a holiday destination in low seasons. El Periplo Sustentable 32. [Google Scholar]
- Shewhart WA, Wilks S. 2016. Time series analysis: forecasting and control. Hoboken: John Wiley & Sons, p. 669. [Google Scholar]
- Spaw RH. 1978. Late Pleistocene Carbonate Bank Deposition: Cozumel Island, Quintana Roo, Mexico. Gulf Coast Assoc Geol Soc Trans 28: 601–619. [Google Scholar]
- Taylor MA, Stephenson TS, Chen AA, Stephenson KA. 2012. Climate change and the Caribbean: review and response. Caribb Stud 40: 169–200. [CrossRef] [Google Scholar]
- Téllez O, Cabrera E, Linares E, Bye R. 1989. Las plantas de Cozumel, Universidad Nacional Autónoma de México, Ciudad de México, p. 75. [Google Scholar]
- Tercera Legislatura Constitucional del Estado de Quintana Roo. (Last reform on June 15, 2017). Decreto Ley 14, Ley de Agua Potable y Alcantarillado del Estado de Quintana Roo. Published in Diario Oficial del Estado de Quintana Roo, on Wednesday, October 6, 1981. [Google Scholar]
- Thornthwaite CW. 1948. An approach toward a rational classification of climate. Geogr Rev 38: 55–94. [CrossRef] [Google Scholar]
- Toews MW, Whitfield PH, Allen DM. 2007. Seasonal statistics: the ‘seas’ package for R. Comput Geosci 33: 944–951. [CrossRef] [Google Scholar]
- Vázquez-Domínguez E, Suárez-Atilano M, Booth W, González-Baca C, Cuarón AD. 2012. Genetic evidence of a recent successful colonization of introduced species on islands: Boa constrictor imperator on Cozumel Island. Biol Invasions 14: 2101–2116. [CrossRef] [Google Scholar]
- Villasuso PMJ, Sánchez y Pinto IA, Canul MC, Casares SR, Baldazo EG, Souza CJ, Poot EP, Pech AC. 2011. Hydrogeology and conceptual model of the karstic coastal aquifer in northern Yucatan state, Mexico. Trop Subtrop Agroecosystems 13: 243–260. [Google Scholar]
- Vosper EL, Mitchell DM, Emanuel K. 2020. Extreme hurricane rainfall affecting the Caribbean mitigated by the Paris agreement goals. Environ Res Lett 15: 104053. [CrossRef] [Google Scholar]
- Ward WC. 1997. Geology of coastal islands, northeastern Yucatan Peninsula. In: Vacher H. and Quinn T. (Eds.), Geology and Hydrogeology of Carbonate Islands. Amsterdam: Elsevier Science, 275–298. [Google Scholar]
- Wurl J, Giese S, Frausto O, Chale G. 2003. Ground Water Quality Research on Cozumel Island, State of Quintana Roo, Mexico. In: Second International Conference on Saltwater Intrusion and Coastal Aquifers— Monitoring, Modeling, and Management, Merida, México, March 30 − April 2, 171–176. [Google Scholar]
- Yadav R, Tripathi SK, Pranuthi G, Dubey SK. 2014. Trend analysis by Mann-Kendall test for precipitation and temperature for thirteen districts of Uttarakhand. J Agrometeorol 16: 164–171. [Google Scholar]
- Zepeda QDS, Loeza RCM, Munguía VNE, Peralta JE, Velázquez CLE. 2018. Sustainability strategies for coastal aquifers: A case study of the Hermosillo Coast aquifer. J Clean Prod 195: 1170–1182. [CrossRef] [Google Scholar]
Cite this article as: Hernández-Flores G, Gutiérrez-Aguirre MA, Cervantes-Martínez A, Marín-Celestino AE. 2021. Historical analysis of a karst aquifer: recharge, water extraction, and consumption dynamics on a tourist island (Cozumel, Mexico). Ann. Limnol. - Int. J. Lim. 57: 16
All Tables
Descriptive statistics and results for the autocorrelation function (r1) (α = 0.05).
Results from MKt and Seńs slope. Estimated trends are significant with an α = 0.05.
All Figures
|
Fig. 1 Location of CAPA wells, UGA C1, elevations and stratigraphy column on Cozumel Island. Modified of Local Ecological Zoning Plan (2008). |
| In the text | |
|
Fig. 2 Schematic framework of the methods used in this research. In grey, information sources and considered time periods. Green indicates hydrometeorological and hydrological indicators. In dark blue, analysis performed to indicators. In blue cyan, information represented in maps. Orange arrows represent indicators that were calculated. |
| In the text | |
|
Fig. 3 Monthly annual variations in each indicator within their analysed time period. |
| In the text | |
|
Fig. 4 Monthly precipitation (a) and mean temperature (b) registered in Cozumel from 1989 to 2019. |
| In the text | |
|
Fig. 5 Estimated Evapotranspiration from 1989 to 2019. |
| In the text | |
|
Fig. 6 Estimated aquifer recharge for Cozumel from 1990 to 2019. |
| In the text | |
|
Fig. 7 Monthly water extraction volume from CAPA wells from 2005–2018. |
| In the text | |
|
Fig. 8 Monthly water consumption from different sectors from 2005–2018. The secondary axis corresponds to the domestic water consumption volume. |
| In the text | |
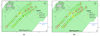 |
Fig. 9 Location and status of CAPA wells from 2013 (Fig. 9a) and 2018 (Fig. 9b). |
| In the text | |
Current usage metrics show cumulative count of Article Views (full-text article views including HTML views, PDF and ePub downloads, according to the available data) and Abstracts Views on Vision4Press platform.
Data correspond to usage on the plateform after 2015. The current usage metrics is available 48-96 hours after online publication and is updated daily on week days.
Initial download of the metrics may take a while.