Fig. 2
Download original image
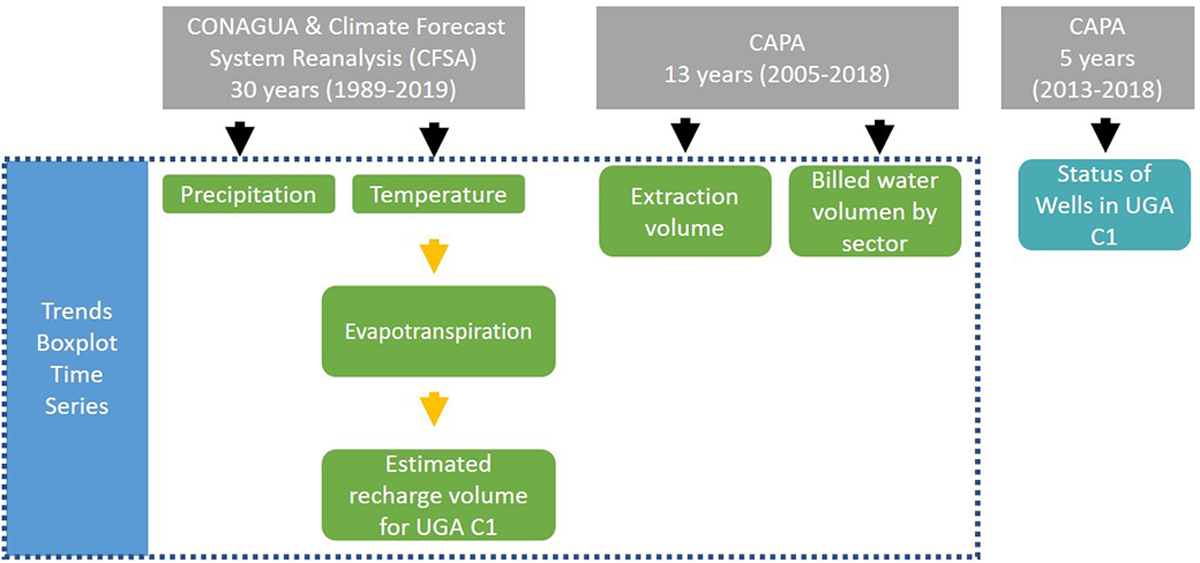
Schematic framework of the methods used in this research. In grey, information sources and considered time periods. Green indicates hydrometeorological and hydrological indicators. In dark blue, analysis performed to indicators. In blue cyan, information represented in maps. Orange arrows represent indicators that were calculated.
Current usage metrics show cumulative count of Article Views (full-text article views including HTML views, PDF and ePub downloads, according to the available data) and Abstracts Views on Vision4Press platform.
Data correspond to usage on the plateform after 2015. The current usage metrics is available 48-96 hours after online publication and is updated daily on week days.
Initial download of the metrics may take a while.