| Issue |
Int. J. Lim.
Volume 58, 2022
|
|
|---|---|---|
| Article Number | 1 | |
| Number of page(s) | 13 | |
| DOI | https://doi.org/10.1051/limn/2022001 | |
| Published online | 09 February 2022 | |
Research Article
Phytoplankton community composition variation under natural and prolonged saline intrusion simulations
1
Can Tho University and staff of Faculty of Agriculture and Food Technology, Tien Giang University, Vietnam
2
College of Aquaculture and Fisheries, Can Tho University, Vietnam
* Corresponding author: This email address is being protected from spambots. You need JavaScript enabled to view it.
Received:
12
July
2021
Accepted:
9
January
2022
Abstract
This study assessed phytoplankton community composition variation under two discrete salinity intrusion rate experiments. Experiment 1 simulated salinization under short-term, natural tidally induced rates of salinity change typical of the Mekong Delta, Vietnam (0–30‰ in 6 h), while Experiment 2 simulated salinization under a longer, more gradual rate of salinity change (0–30‰ at 5‰ increase per week). Phytoplankton community composition was, overall, more abundant following prolonged salinity change (Experiment 2) than rapid, tidally-induced salinity change (Experiment 1). Under both experimental conditions phytoplankton species number and density varied with changes in salinity, indicating a strong effect of salinity regardless of its rate of change. At the end of the salinity acclimation, Cyanobacteria, Chlorophyta, Euglenophyta and Bacillariophyta were all most abundant at a salinity of 5‰ after a short-term tidally simulated change in salinity, but with a longer, more gradual change in salinity, the abundance of different groups varied with salinity; With a longer, more gradual change in salinity, Chlorophyta was most abundant at 5–10‰ salinity, while Cyanobacteria, Euglenophyta and Bacillariophyta were all most abundant at a salinity of 5‰. The species composition in treatments of less than 10‰ had high similarity with the freshwater environment while treatments of 30‰ (Experiment 1) and 25‰ (Experiment 2) had high similarity with the natural seawater environment. This study demonstrates the utility of mesocosm experiments for understanding phytoplankton community composition variation in natural aquatic ecosystems under rapid and prolonged saline intrusion rates and predicting associated impacts on food webs in natural water bodies and aquaculture systems.
Key words: Phytoplankton composition / salinization / simulation experiments / salinity impact
© EDP Sciences, 2022
1 Introduction
Phytoplankton communities play an important role within the natural food webs of aquatic ecosystems and shifts in the composition of the phytoplankton community impacts on biological productivity (Lavens and Sorgeloos, 1996; Das et al., 2012). The composition of phytoplankton communities composition is influenced by changes in water quality, weather, and the substratum (Steinberg et al., 2015; Prado et al., 2017; Majewska et al., 2017). Changes in salinity, in particular, have been shown to strongly influence phytoplankton community composition and biomass in water bodies (Angles et al., 2015; Donadel et al., 2016; Lecher et al., 2017).
Previous studies have also demonstrated that salinity variation was the main factor affecting the structure and abundance of phytoplankton community (Dor and Ehruch, 1987; Kondo et al., 1990; Sigaud and Aidar et al., 1993; Barron et al., 2002). When investigating the effect of salinity stress on phytoplankton abundance and growth, Floder et al. (2010) reported that salinity had a considerable influence on composition, diversity and growth. Salinity was also demonstrated to be one of the primary factors affecting species richness and evenness of phytoplankton communities in microcosm experiments conducted in the Great Salt Lake, Utah, USA (Larson and Belovsky et al., 2013). Salinity and heat shock were also shown to alter the composition and significantly reduce species richness of the coastal Mediterranean phytoplankton species in a mesocosm experiment (Stefanidou et al., 2018). When assessing the response of shallow water phytoplankton to salinity enrichment, McGowan et al. (2020) reported that salinization led to an increase in biomass of planktonic siliceous algae (anion of Cl ≥ 1600 mg• L−1) as well as chlorophytes and cyanobacteria (anion of Cl ≥ 2500 mg •L−1). Zhang et al. (1999) investigated the effects of salinity on algae growth in the Greenland Sea and reported that algae species composition was dependent on salinity with Chaetoceros spp. and Nitzschia spp. (Bacillariophyta) observed to be the most abundant algae in low (≤12.2‰) and high (>12.2‰) salinity conditions, respectively. In addition, Barron et al. (2002) demonstrated that Cyanobacterial heterocyst number increased in all salinities with the largest increase found in 2.3‰; however, Herbst and Blinn (1998) reported that the Cyanobacteria species such as Oscillatoria spp. occurred in very high salinity conditions (50–100‰). Moreover, Moisander et al. (2002) and Pade and Hagemann (2015) reported that Cyanobacteria can adapt quickly to high salinity stress or sudden salinity fluctuations because of salt resistance genes. Chakraborty et al., 2011 revealed that Cyanobacteria from the Godavari River estuary in India had become adapted to sudden salinity changes because of their unique ability to increase zeaxanthin production, which helps them to outcompete Chlorophyta under low salinization conditions. Johnson (2015) also claimed that Cyanobacteria exhibited better salinity tolerance than Chlorophyta leading to Cyanobacteria becoming more widely distributed in the California Delta (USA).
In Vietnam, the Mekong Delta (MD) is the largest delta and provides important ecosystem services that support the livelihood and agricultural production of the local peoples. Importantly, the MD is also the largest and most rapidly developing aquaculture region in Vietnam. In recent years, saline intrusion has become more severe in the MD, which has led to substantial damage to agriculture and aquaculture in the area (Duyen et al., 2012; Tri, 2016). Moreover, salinity intrusion in the MD likely to be exacerbated by a combination of rising sea levels and a reduction in freshwater flow during the dry season as a result of the construction of dams upstream on the Mekong River (Hoanh et al., 2003; Tuan et al., 2007; Sunada, 2009). As such, it is of increasing importance to understand the impact of salinity on the composition of phytoplankton communities, especially in the MD. This study utilized two discrete saline intrusion simulation models (Experiment 1 and Experiment 2; see Methods) to assess the impact of two different rates of salinity change, a rapid change of over a period of six hours to simulate the daily tidal cycle, and a more gradual change over a period of six weeks, on the composition of the phytoplankton community in Mekong River water under laboratory conditions. The hypothesis for both experiments was that phytoplankton community structure will fluctuate markedly when saline intrusion occurs under simulated conditions. Increasing salinity may affect the species composition of phytoplankton and their abundance. Moreover, the fluctuation and increasing of salinity could lead to increase of dinoflagellates and cyanobacteria which are the harmful algae that could damage the ecosystem as well as aquaculture in the MD. The role of phytoplankton community is essentially part in food webs of the aquatic ecosystem. Due to, these change could negatively impact on aquatic ecosystems and fisheries productivity; however, these have not been researched in the MD. The result of study will demonstrate clearer how the salt water intrusion impacts on the composition (i.e. structure and abundance) of phytoplankton under tidal cycle in MD.
2 Materials and methods
2.1 Experimental design
The impact of salinity and its rate of change on the composition of phytoplankton communities was assessed in two experiments. Both experiments were conducted in outdoor 1m3 composite tanks designed to resemble natural conditions, and both experiments had the same eight salinity treatments: 0‰ (freshwater control-T0), 5‰ (T5), 10‰ (T10), 15‰ (T15), 20‰ (T20), 25‰ (T25), 30‰ (T30), and 32‰ (seawater control-T32), each with three replicate tanks. At the beginning of each experiment, a 20 cm thick layer of mud from the same source in the Hau River (a tributary of the Mekong River) was added to the bottom of all tanks. Then 400 liters of unfiltered coastal sea water (32‰ salinity) from nearby Soc Trang Province (Fig. 1) was added to the three seawater control (T32) tanks in each experiment, and 400 liters of unfiltered freshwater (0‰ salinity) from the Hau River was added to all other tanks. In Experiment 1 (Exp. 1), unfiltered coastal sea water from Soc Trang Province (32‰ salinity) was siphoned into each treatment tank (except tanks with the two control treatments, T0 and T32) from a 4 m3 holding tank at a rate to reach the target salinity of the treatment tank (5‰, 10‰, 15‰, 20‰, 25‰ or 30‰) over a period of six hours, in order to simulate the short-term increase in salinity likely to be associated with a rising tide. The salinity was then maintained at the target level for a further eight weeks. In Experiment 2 (Exp. 2), on the other hand, salinity was increased more slowly, in steps of 5‰ over a period of a week, until the target salinity was reached, after which the salinity was maintained at the target level for that treatment until the end of the eight week experiment. For example, the 5‰ salinity treatment was imposed in one week and then maintained at that salinity for seven weeks, whereas at the other end of the salinity range, it took six weeks to reach the target salinity of 30‰ (5‰ per week) and this target salinity was maintained only for two weeks when the experiment was terminated. The salinity of both control treatments (0‰, T0 and 32‰, T32) remained unchanged throughout the experiment. The composition of phytoplankton in the freshwater and seawater sources at the start of the experiment is shown in Table 2. Both experiments were conducted over a period of eight weeks at the College of Aquaculture and Fisheries, Can Tho University, Vietnam.
 |
Fig. 1 Diagram of saline intrusion simulation experimental system. A regulated amount of seawater was used to bring each experimental tank to the target experimental salinity in 6 hours (Experiment 1) or at 5% increase per week (Experiment 2). Each treatment was conducted in triplicate. |
Water environmental parameters in both experiments.
The initial composition of phytoplankton in freshwater and seawater resources which used in two experiments.
2.2 Environmental parameters and phytoplankton sample collection and sample analysis
Water samples for the analysis of phytoplankton populations were collected from the freshwater control at the start of the experiment, and from all salinity treatments at weekly intervals thereafter. The weekly samples in Exp. 2 were collected during the transition time for each salinity treatment. For phytoplankton, a one liter water sample was collected across several locations within each tank and fixed with 2–4% formalin. Following formalin fixation, all phytoplankton species present within each water sample (i.e., each treatment tank) were identified using both international and Vietnam taxonomic keys (Shirora, 1996; An, 1993; Tien and Hanh, 1997;
Sy, 2005; Bellinger and Sigee, 2010). Each water sample was then passed through a Sedgewick-Rafter counting chamber to count the number of each phytoplankton species present. Species-specific densities were determined using the following formula: where X is the density of phytoplankton species (inds •L−1); T is the number of individuals of each species counted; A is the area of a counting square (1 mm2); N is the number of squares counted (N = 180); Vcđ is the concentrated sample volume (mL); and VM is the sampled volume.
Water samples were also collected weekly from all tanks for the measurement of dissolved oxygen (DO, mg L−1), biological oxygen demand (BOD, mg L−1), chemical oxygen demand (COD, mg.L−1), total ammonia nitrogen (TAN, mg L−1), nitrate (NO3–, mg L−1), total nitrogen (TN, mg L−1), phosphate (PO43–, mg L−1) and total phosphorus (TP, mg L−1), analyzed using standard methods APHA (1995). Temperature and pH were measured in situ in the tanks using a thermometer and pH meter, respectively.
2.3 Data analysis
Data were analyzed using Excel 2010, SPSS 20.0, PRIMER 6.0 and PAST 4.08. Data for phytoplankton density were Log10 transformed to ensure normality and homoscedasticity, and significant differences between treatments in species-specific densities (number of individuals per liter) of each phytoplankton phylum at the end of both experiments were analysed with a one-way analysis of variance (ANOVA with Tukey test, α = 0.05) using SPSS 20.0 statistical software. SIMPER and ANOSIM were used to compare phytoplankton community structure between T0 (freshwater control), T32 (seawater control) and different salinity treatments. The species-specific densities (number of individuals per liter) of each phytoplankton phylum at the end of both experiments were also analyzed using SIMPER and ANOSIM.
3 Results
3.1 Water environmental parameters in both experiments
Ten water environmental parameters in the freshwater sample (FW), sea water sample (SW) and other treatments at the end of both experiments were monitored including temperature, pH, DO, BOD5, COD, nitrate, TAN, TN, phosphate and TP (Tab. 1). All parameters were within the normal range for aquatic ecosystems. At the end of both experiments, environmental parameters between T0 (freshwater control), T32 (seawater control) and other treatments were slightly different, however this variation was low across the investigation period (Tab. 1). Surprisingly, nitrate was not detected in FW, SW or all treatments in either experiment (Tab. 1).
3.2 Composition and abundance of phytoplankton in water used for both experiments
The composition and abundance of phytoplankton in freshwater sample (FW) and sea water sample (SW) used in both experiments are shown in Table 2. The same fresh water source was used for the fresh water control treatment,T0, and as the initial water source for treatments T5, T10, T15, T20, T25 and T30, so they all had the same initial phytoplankton composition and density (see Methods).
At the beginning of Exp. 1, there were a total of 50 phytoplankton in fresh water, made up of five species of Cyanobacteria, 19 species of Chlorophyta, 23 species of Euglenophyta, and four species of Bacillariophyta, while in sea water there were three species of Cyanobacteria, seven species of Chlorophyta, six species of Euglenophyta, and four species of Bacillariophyts, for total of only 20 species (Tab. 2). The density of phytoplankton in fresh water at the start of Exp. 1 was 662,704 inds• L−1, with Chlorophyta, (405,074 inds L−1) and Euglenophyta (186,241 inds• L−1), together accounting for almost 90% of the total density (Tab. 2). By contrast, the density of phytoplankton in seawater at the start of Exp. 1 was much lower (367,187 inds• L−1), but again the population was dominated mainly by two groups, Bacillariophyta (227,470 inds• L−1) and to a lesser degree by Chlorophyta (76,609 inds• L−1) (Tab. 2).
The number of phytoplankton species at the start of Exp. 2 was slightly higher, in both fresh water (68 species) and sea water (29 species), than in Exp. 1, but the number of species in each group was similar to that in Exp. 1, for both fresh water and sea water (Tab. 2). However, phytoplankton densities in both fresh water (451,305 inds• L−1) and sea water (35,941 inds• L−1) at the start of Exp. 2 were signifiantly lower than those in Exp. 1 (Tab. 2). Unlike Exp. 1, Bacillariophyta had significantly higher densities than other groups, both in fresh water and notably so in seawater (Tab. 2).
3.3 Species composition of phytoplankton
The species composition of phytoplankton was determined at the end of both experiments and shown in Figure 2. A total of 21 and 40 species was recorded in Exp. 1 and Exp. 2, respectively (Tab. S2). In Exp. 1, Chlorophyta accounted for greatest number of taxa (8), followed by Bacillariophyta (6 taxa), and Euglenophyta (5 taxa). Cyanobacteria was the fewest taxa (2). In Exp. 2, Chlorophyta and Bacillariophyta accounted for the same number of species (12 taxa), followed by Euglenophyta (11 taxa) and Cyanobacteria (5 taxa).
There was an overall decline in the total number of phytoplankton species with increasing salinity in both experiments (Fig. 2). In Exp. 1, there were 14 species at T0 and the number dropped sharply with increasing salinity to just four species at T32. Likewise, the number of phytoplankton species decreased sharply with increasing salinity, from 20 at T0 to three at T32 in Exp. 2 (Fig. 2). The reduction in species number varied between groups; the most dramatic being in Chlorophyta, where the number of species dropped from seven (Exp. 1) and 10 (Exp. 2) in fresh water (T0) to zero at all salinities of 25‰ and above, apart from one species in the sea water control treatment (T32), where the salinity remained unchanged for the duration of the experiment (Fig. 2). A similar pattern in species number with increasing salinity was observed in the Euglenophyta (Fig. 2). The number of species in Cyanobacteria and Bacillariophyta fluctuated markedly and there was only a slight downward trend in species number with increasing salinity in the Bacillariophyta (Fig. 2). Additionally, cumulative dominance (%) and species rank differed between Cyanobacteria and the other three phyla (Fig. 3). More specifically, Cumulative dominance increased faster in Exp. 1 (Fig. 3a) than in Exp. 2 (Fig. 3b) with Cyanobacteria exhibiting the highest species rank in both experiments (Fig. 3). The relationship between cumulative dominance and species rank appears dependent on the rate of salinity shift, especially for Cyanobacteria.
In Exp. 1, the SIMPER analysis performed at the end of the experiment showed a total dissimilitude of 65% among treatments (ANOSIM, R = 0.8085 P = 0.0001) (Tab. 3). The greatest differences were found between T0 (freshwater control) and T20 (93.3%, R = 1 P = 0.103) and T32 (seawater control) and T5 (79.3%, R = 1 P = 0.1034). The smallest differences were found between T0 (freshwater control) and T5 (70.6%, R = 1 P = 0.1039) and T32 (seawater control) and T30 (39.1%, R = 1 P = 0.1051). Moreover, throughout the treatments from T5-T30, the greatest difference was found between T5 and T20 (97.1%, R = 1 P = 0.1009) whereas, the smallest difference was found between T10 and T15 (21.4%, R = –0.2222 P = 0.297) (Tab. 3).
In Exp. 2, the SIMPER analysis showed a total dissimilitude of 73.9% among treatments (ANOSIM, R = 0.7827 P = 0.0001) (Tab. 3). The greatest differences were found between T0 (freshwater control) and T30 (92.3%, R = 0.6667 P = 0.0975) and T32 (seawater control) and T20 (76.6%, R = 1 P = 0.0993). The smallest differences were found between T0 (freshwater control) and T5 (70.5%, R = 0.667 P = 0.0995) and T32 (seawater control) and T25 (41.0%, R = 1 P = 0.0993). Additionally, throughout the treatments from T5-T30, the smallest difference was found between T15 and T20 (50.7%, R = 1 P = 0.1039) and the greatest difference was found between T5 and T20 (89.3%, R = 1 P = 0.1008) (Tab. 3).
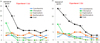 |
Fig. 2 The species composition of phytoplankton at the end of both experiments. |
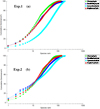 |
Fig. 3 Cumulative dominance (%) and species rank of 4 phytoplankton phyla in Experiment 1 (a) and Experiment 2 (b). |
The result of SIMPER and ANOSIM analysis in both experiments.
3.4 Phytoplankton abundance
Densities of phytoplankton in different treatments of both experiments are shown in Figure 4, Figure 5 and Table 4. In Exp. 1, Cyanobacteria were more abundant in treatments T5, T10, T15, T25, T30 and T32, while Bacillariophyta were more abundant in T20. In the fresh water treatment, T0, Chlorophyta had the highest density, followed by Euglenophyta and Bacillariophyta (Fig. 4). No Chlorophyta were recorded in T10, T15, T20, T25 and T30 (Fig. 4 and Tab. 4).
In Exp. 2, for all salinities except fresh water (T0) and 20‰ (T20), Cyanobacteria had the highest density, followed by Bacillariophyta, while Euglenophyta had the lowest density (Fig. 5). As in Exp. 1, Chlorophyta was most abundant in T0, followed by Euglenophyta. Bacillariophyta was most abundant in T20. Chlorophyta was not recorded in treatments with a salinity higher than 25‰ (Fig. 5 and Tab. 4).
The results of ANOVA analysis of phytoplankton density in different treatments at the end of both experiments are shown in Table 4. Significant differences in phytoplankton density were found at the end of the Exp. 1 (F = 78.7 P = 0.000) and Exp. 2 (F = 289.7 P = 0.000) between T0 (freshwater control), T32 (seawater control) and other treatments (Tab. S1). Significant differences in densities between treatments were found for all phytoplankton phyla including Cyanobacteria (F = 59.4 P = 0.000 in Exp. 1; and F = 91.5 P = 0.000 in Exp. 2), Chlorophyta (F = 944.5 P = 0.000 in Exp. 1 and F = 4634 P = 0.000 in Exp. 2), Euglenophyta (F = 2733.2 P = 0.000 in Exp. 1 and F = 574.3 P = 0.000 in Exp. 2), and Bacillariophyta (F = 18.8 P = 0.000 in Exp. 1 and F = 151.9 P = 0.000 in Exp. 2) (Tab. 4).
In Exp. 1, the total density of phytoplankton tended to decrease gradually from T0 (40,114 inds• L−1) to T20 (2883 inds L−1) and was significantly different (Tab. 4). Cyanobacteria density fluctuated, which increased from T0 (6644 inds• L−1) to T5 (20,913 inds• L−1) then decreased in T10 (13,674 inds L•−1), T15 (12,690 inds• L−1) and dropped sharply in T20 (559 inds L−1). Density of Bacillariophyta varied irregularly in all other treatments. The highest density was observed in T5 (8215 inds L−1) and significantly different (ANOVA P < 0.05) to other treatments except T0 (6444 inds• L−1). For Euglenophyta, the densities reduced remarkably from T0 (9029 inds• L−1) to T10 (552 inds L−1) and a significant difference (ANOVA P < 0.05) was found between the three treatments. Especially, in all treatments with salinity from T20 to T32, Euglenophyta was not found. Density of Chlorophyta decreased strongly from T0 (17,933 inds• L−1) to T5 (2409 inds L−1) and this group was not detected in T10, T15, T20, T25 and T30 (Tab. 4).
Similar to Exp. 1, at the end of Exp. 2, total phytoplankton density tended to decrease gradually from T0 (112,827 inds L−1) to T15 (18,033 inds L−1). Cyanobacteria density also varied irregularly. The highest density was observed in T5 (20,926 inds L−1) which differed significantly (ANOVA P < 0.05) from all other treatments except T0 (17,927 inds L−1). The density of Bacillariophyta was highest in T5 (25,509 inds L−1) and significantly different (ANOVA P < 0.05) to all other treatments. Chlorophyta and Euglenophyta density fluctuated similarly to each other. The highest densities was found in T0 (44,535 inds L−1 for Chlorophyta and 35,930 inds L−1 for Euglenophyta) and significantly different (ANOVA P < 0.05) to the other treatments, except Euglenophyta in T0 and T5). Chlorophyta and Euglenophyta were not recorded in T25, T30 and T32 (Tab. 4).
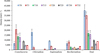 |
Fig. 4 The structure of density of phytoplankton phyla at different treatments in Experiment 1. |
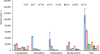 |
Fig. 5 The structure of density of phytoplankton phyla at different treatments in Experiment 2. |
The densities of phytoplankton phyla at the end of both experiments.
4 Discussion
4.1 Phytoplankton community composition
Under both experimental conditions, species number for Chlorophyta (green algae) and Bacillariophyta (diatom) were observed to be higher than that of Cyanobacteria and Euglenophyta (see Supplementary Material). Several studies have demonstrated that Chlorophyta species perform best in freshwater or low salinity environments (Sy, 2005; Hamilton et al., 2000). In addition, many Bacillariophyta species are known to be broadly distributed from freshwater to seawater environments (Stanca et al., 2013; Pratiwi et al., 2018). The Hau River is a typical freshwater-to-low salinity ecosystem and, thus, Chlorophyta species, Bacillariophyta species, and their corresponding resting spores are abundant in the water column and bottom mud. Therefore, the greater diversity of Chlorophyta and Bacillariophyta species observed under both experimental conditions could be due to their greater natural abundance the water and mud used in both experiments. For species composition structure, all treatments with salinity less than 10‰ had high similarity compared with freshwater environment (FW control-T0) in both experiments. In comparison with natural seawater (SW control-T32), the species composition structure had high similarity at salinity of 30‰ for the simulation of tidally-induced saline intrusion, and 25‰ for the simulation of more gradual saline intrusion over weekly stepwise increase in salinity. Many species of Cyanobacteria, Chlorophyta and Euglenophyta are widely distributed and have high densities in freshwater bodies and those with low salinity, and so the phytoplankton structure in all treatments with less than 10‰ salinity (T5, T10), which is typical of water near the mouth of the Hau River had a high similarity with the natural freshwater environment (T0). In contrast, some other phytoplankton species, such as Bacillariophyta, tend to be more salinity tolerant and are more widely distributed in environments with higher salinity, thus, the similarity of phytoplankton structure in the 25‰ and 30‰ treatments with natural seawater (T32).
Our observations that Bacillariophyta species were the most abundant group under both natural, tidally-induced and longer-term, more gradual changes in salinity mirror the findings of previous research on the effects of salinity on phytoplankton community composition under natural and experimental conditions. Additionally, in MD, Bacillariophyta was reported to be the most abundant phytoplankton phyla in the Mekong Delta tributary Ba Lai River (Luu et al., 2017) as well as the Soc Trang to Bac Lieu coastal areas of Vietnam (Van et al., 2012). In aquaculture, many Bacillariophyta species have been used as high nutrient live feed (Brown, 2002; Conceicao et al., 2010; Vicose et al., 2012; Xia et al., 2013). The abundance of Bacillariophyta species observed in our experiments could benefit MD fisheries and aquaculture (e.g., brackish water shrimp industry).
4.2 Effects of salinity changes on phytoplankton community composition
Our results show that fluctuations in salinity caused by the tidal cycle, or more grandual changes in salinity over a time frame of a week or more, influenced significantly the species composition and structure of the phytoplankton community. These changes in salinity are typical of that due to saline intrusion in the MD, and their extent varies with distance from the river mouth, tidal amplitude and river flow rate. Overall, phytoplankton species number and density tended to decrease when salinity increased under both experimental shift rates and phytoplankton abunadance was highest in T0 (FW control) and lowest in T30 in both salinization simulation systems (Tab. 4 and Fig. 2). When salinity varied on the time scale of a tidal cycle, a salinity of less than 5‰ (T0, T5) was optimum for phytoplankton to reach higher densities, whereas their abundance decreased at alinities above 10‰. When salinity changed over a longer duration, phytoplankton density decreased gradually with increased salinity from 0 to 15‰. Previous studies have also demonstrated that salinity variation was the main factor affecting phytoplankton community composition. When investigating the effect of salinity stress on phytoplankton abundance and growth, Floder et al. (2010) reported that salinity had a considerable influence on composition, diversity, growth, and biomass. Salinity was also demonstrated to be one of the primary factors affecting species richness and evenness of phytoplankton communities in microcosm experiments conducted in the Great Salt Lake, Utah, USA (Larson and Belovsky, 2013). Zhang et al. (1999) investigated the effects of salinity on growth rates of Arctic-sea-ice algae from the Greenland Sea and reported that algae abundance increased over a wide salinity range (4–74‰) but decreased in the highest tested salinity (90.8‰). Salinity was also shown to alter the composition and significantly reduce species richness of the coastal Mediterranean phytoplankton species in a mesocosm experiment (Stefanidou et al., 2018). Larson and Belovsky, 2013) and Stefanidou et al. (2018) investigated the influence of salinity on phytoplankton community composition in microcosm experiments in the Great Salt Lake and coastal Mediterranean, respectively, and both reported that salinity was inversely correlated with phytoplankton species richness. Taken together, these studies demonstrate that salinity affects phytoplankton community composition under both simulated experimental conditions natural conditions. Our study observed the same inverse relationship between salinity and phytoplankton species abundance and diversity (salinity shift rate dependent) and, therefore, demonstrates that the observed shifts in phytoplankton community composition could be used to accurately predict the likely changes in the MD phytoplankton community composition under naturally occurring salinity shifts. Moreover, in our experiment, the higher total phytoplankton densities observed in Exp. 2 samples indicates that phytoplankton perform better under slower rates of salinity change (5‰ per week) than faster rates (within 6 hours), and indicates that short-term, rapid changes in salinity, and longer-term more gradual changes in salinity affected phytoplankton community structure in different ways and to different degrees. This is because salinity changes over a longer time may have helped phytoplankton adapt to salinity changes better than salinity changes within 6 hours. Therefore, the salinity-dependent changes in phytoplankton community composition observed in this study can be used to predict the expected shifts in the wild phytoplankton community composition when natural salinity shifts occur within the Mekong Delta (e.g., under climate change predictions).
Our study indicates that the variation of salinity either by within a tidal cycle or weekly basic made different effects on Bacillariophyta composition. In this study, diatoms were widely distributed across the salinity range tested in both experiments (from T0 to T32). This tendency indicates that fluctuation of salinity induced either by a tidal cycle or more gradual changes due to salt intrusion in the Mekong Delta are likely to have little effect on Bacillariophyta. The ability of diatom species to thrive under broad salinity conditions when salinity shift is relatively slow is evolutionarily advantageous; however, more rapid salinity shifts (within 6 hours) strongly influenced diatom species abundance and suggests that diatom species may be at an evolutionary disadvantage in geographic locations where salinity shifts rapidly (e.g., daily). Both experiments demonstrated that Chlorophyta, Euglenophyta generally preferred lower salinities (0–5‰) and disappeared in higher salinities (25–32‰). Cyanobacteria, like Bacillariophyta, grew well in all salinities. These findings align with previous observations regarding the distribution and growth of Chlorophyta and Euglenophyta under varying salinity conditions. Luu et al. (2017) reported that Chlorophyta species abundance increased with decreased salinity in the Ba Lai River estuary, which is a tributary of the Mekong River in the MD. Lueangthuwapranit et al. (2011) reported that Chlorophyta and Euglenophyta species composition exhibited a significant negative correlation with salinity in the Na Thap River estuary in Thailand but that this was reversed during the local rainy season (i.e., under naturally reduced salinity conditions). Hamilton et al. (2000) investigated the effects of salinity fluctuations on phytoplankton community composition in Western Australia estuaries and found that the majority of Chlorophyta species were distributed in areas with less than 12‰ salinity. This indicates that Chlorophyta grow well in freshwater or waters with low salinity in both natural water bodies and artificial laboratory conditions. Moreover, our experiment indicates the faster rate of salinity change (Exp. 1) had a large effect on the growth of Chlorophyta and Euglenophyta species, thus their density decreased significantly with increasing salinity. In particular, Cyanobacteria were more abundant in 0–32‰ (T0-T32) in tidal cycle saline intrusion simulation (in Exp. 1) and 0–32‰ (T0-T32) under salinity prolonged shift rate (e.g., weekly in Exp. 2). This indicates that neither short-term, tidally induced fluctuations of salinity nor more gradual fluctuations over a longer period of time had little effect on Cyanobateria. These findings align with previous observations regarding the distribution and growth of Cyanobacteria under varying salinity conditions. Barron et al. (2002) demonstrated that Cyanobacterial heterocyst number increased in all salinities with the largest increase found in 2.3‰, which suggested that Cyanobacteria may be adapted to low (near-freshwater) salinities; however, Herbst and Blinn (1998) reported that Cyanobacteria species Oscillatoria spp. occurred in very high salinity conditions (50–100‰). Interestingly, Moisander et al. (2002) and Pade and Hagemann (2015) demonstrated that Cyanobacteria can adapt quickly to high salinity stress or sudden salinity fluctuations because of salt resistance genes. Chakraborty et al. (2011) reported that Cyanobacteria from the Godavari River estuary in India had become adapted to sudden salinity changes because of their unique ability to increase zeaxanthin production, which helps them to outcompete Chlorophyta under low salinization conditions. Johnson (2015) also reported that Cyanobacteria exhibited better salinity tolerance than Chlorophyta leading to Cyanobacteria becoming more widely distributed in the California Delta (USA). The wide occurrence and distribution of Cyanobacteria can be disadvantageous to aquatic life (Gentile and Maloney, 1960 Gorham, 1964; Seymour, 1980; Anderson et al., 1993; Brusle, 1995; Reinikainen et al., 1995; Bury et al., 1996; Mez et al., 1998; Kuiper-Goodman et al., 1999) whereas Chlorophyta are known to be beneficial as live-feed for aquatic animals (Conceicao et al., 2010; Zahran and Risha, 2014; Radhakrishnan et al., 2015; Pakravan et al., 2018). Therefore, the findings of this study could be used to predict the distribution of Cyanobacteria in natural ecosystems based on salinity, which is important because Cyanobacteria may bloom and replace Chlorophyta in natural saltwater intrusion areas. The presence and dominance of harmful and toxic algae like Cyanobacteria may cause negative impacts on aquatic life in natural water bodies and aquaculture systems based in the MD and therefore, being able to predict shifts in phytoplankton community composition is crucial.
In conclusions, the phytoplankton community was, overall, more abundant when salinity changed more slowly (Exp. 2) than when it changed at a faster rate (Exp. 1). Under both experimental conditions, phytoplankton species number and density varied with salinity, indicating a strong effect of salinity, regardless of its rate of change. Once the target salinity had been reached and it was stable, Cyanobacteria was abundant at all salinities and could have a negative impact on aquatic ecosystems in the case of saline intrusion. Chlorophyta was more dominant in 0–5‰ whereas Bacillariophyta was abundant at all salinities. Euglenophyta was abundant in 0–15‰ the target salinity had been reached. The species composition and phytoplankton community structure at salinities less than 10‰ had a high similarity with the freshwater environment. Similarly, the species composition and community structure at salinities greater than 25‰ also showed a high similarity to the natural seawater environment. This study demonstrates the utility of mesocosm experiments for understanding and predicting the variation in composition of phytoplankton communities in natural aquatic ecosystems under rapid and prolonged saline intrusion rates (e.g., in the MD) as well as associated impacts on food webs in natural water bodies and aquaculture systems.
Supplementary Material
Table S1. The result of multiple comparisons Tukey HSD test (α = 0.05) by ANOVA analysis.
Table S2. List of phytoplankton species including Cyanobacteria, Chlorophyta, Euglenophyta and Bacillariophyta found at the end of both saline intrusion simulation experiments.
Access Supplementary MaterialAcknowledgements
This study is funded in part by the Can Tho University Improvement Project VN14-P6, supported by a Japanese ODA loan. The authors also thank Richard C. Edmunds and Barry Clough for their assistance with English language editing.
References
- An TN. 1993. Taxonomy of marine-planktonnic silic algae in Vietnam. Vietnam Science and Technology Publishing House. [Google Scholar]
- Anderson JJ, Lou HA, Chen DZX, et al. 1993. Chemical and biological evidence links microcystins to salmon netpen liver disease. Toxicon 31: 1315–1323. [CrossRef] [PubMed] [Google Scholar]
- Angles S, Jordi A, Campbell L. 2015. Responses of the coastal phytoplankton community to tropical cyclones revealed by high-frequency imaging flow cytometry. Limnol Oceanogr 60: 1562–1576. [CrossRef] [Google Scholar]
- Barron S, Weber C, Marino R, Davidson E, Tomasky G, Howarth R. 2002. Effects of varying salinity on phytoplankton growth in a low-salinity coastal pond under two nutrient conditions. Biol Bull 203: 260–261. [CrossRef] [PubMed] [Google Scholar]
- Bellinger EG, Sigee DC. 2010. Fresh water algae (Identification and use as Bio-indicator). Wiley-Blackwell Publishing House. [CrossRef] [Google Scholar]
- Brown MR. 2002. Nutritional value of microalgae for aquculture. Avances en Nutrición Acuícola VI. Memorias del VI Simposium Internacional de Nutrición Acuícola. 3 al 6 de Septiembre del. Cancún, Quintana Roo, México. [Google Scholar]
- Brusle J. 1995. The impact of harmful algal blooms on finfish mortality, pathology and toxicology. Reperes Ocean, 10, 75 pps. [Google Scholar]
- Bury NR, Flik G, Eddy FB, Codd GA. 1996. The effects of cyanobacteria and the cyanobacterial toxin microcystin-LR on Ca21 transport and Na1-K1 ATPase in tilapia gills. J Exp Biol 199: 1319–1326. [CrossRef] [PubMed] [Google Scholar]
- Chakraborty P, Acharyya T, Babu PVR, Bandhyopadhyay D. 2011. Impact of salinity and pH on phytoplankton community in a tropical freshwater system: an investigation with pigment analysis by HPLC. J Environ Monit 13: 614–620. [CrossRef] [PubMed] [Google Scholar]
- Conceicao LEC, Yufera M, Makridis P. 2010. Live feeds for early stages of fish rearing. Aquaculture 41: 613–640. [CrossRef] [Google Scholar]
- Das P, Mandal SC, Bhagabati SK, Akhtar MS, Singh SK. 2012. Important live food organisms and their role in aquaculture. Narendra Publishing House. [Google Scholar]
- Donadel L, Cardoso LS, Torgan LC. 2016. Plankton community dynamics in a subtropical lagoonal system and related factors. Anais da Academia Brasileira de Ciencias (Annals of the Brazilian Academy of Sciences) 88: 249–267. [CrossRef] [PubMed] [Google Scholar]
- Dor I, Ehruch A. 1987. The effect of salinity and temperature gradients on the distribution of littoral microalgae in experimental solar ponds, dead sea area, Israel. Mar Ecol 8: 193–205. [CrossRef] [Google Scholar]
- Duyen PLM, Tri VPD, Hieu NT. 2012. Assessing changes in land use systems under the impact of climate change and sea level rise in Vinh Chau district, Soc Trang province. J Sci Can Tho Univ 24a: 253–263. [Google Scholar]
- Floder S, Jaschinski S, Wells G, Burns CW. 2010. Dominance and compensatory growth in phytoplankton communities under salinity stress. J Exp Mar Biol Ecol 395: 223–231. [CrossRef] [Google Scholar]
- Gentile JH, Maloney TE. 1960. Toxicity and environmental requirements of a strain of Aphanizomenonflos-aquue Ralfs. Can J Microbial 15: 165–173. [Google Scholar]
- Gorham PR. 1964. Toxic algae. Algae and Man. New York, NY: Plenum Press, pp. 307–336. [CrossRef] [Google Scholar]
- Hamilton DP, Chan TU, Robson BJ, Hodges BR. 2000. The effects of freshwater flows and salinity on phytoplankton biomass and composition in an urban estuary, the Swan River, Western Australia. To appear in Proceedings, 3rd International Hydrology and Water Resources Symposium. Hydro 1: 114–119. [Google Scholar]
- Herbst DB, Blinn DW. 1998. Experimental mesocosm studies of salinity effects on the benthic algal community of a saline lake. J. Phycol 34: 772–778. [CrossRef] [Google Scholar]
- Hoanh CT, Guttuman H, Droogers P, Aerts J. 2003. Water, Climate, Food, and Environment in the Mekong basin in SouthAsia. Final report, contribution to the adaption strategies to changing environment ADAPT project. International Water Management Institute. [Google Scholar]
- Johnson AN. 2015. Effects of salinity and temperature on phytoplankton community of San Francisco estuary. Masteral thesis. Marine Biology Faculty, San Francisco University. [Google Scholar]
- Kondo K, Seike Y, Date Y. 1990. Relationships between phytoplankton occurrence and salinity or water temperature in brackish lake Nakanoumi, 1979–1986. Jpn J Limnol 51: 173–184. [CrossRef] [Google Scholar]
- Kuiper-Goodman T, Falconer I, Fitzgerald J. 1999. Human health aspects. Toxic cyanobacteria in water. A guide to their public health consequences, monitoring and management. Published by E & FN Spon on behalf of the World Health Organization, 113–154. [Google Scholar]
- Larson C, Belovsky GE. 2013. Salinityand nutrients influence species richness and evenness of phytoplankton communities in microcosm experiments from Great Salt Lake, Utah, USA. J. Plankton Res 35: 1154–1166. [CrossRef] [Google Scholar]
- Lavens P, Sorgeloos P. 1996. Manual on the production and use of live food for aquaculture. FAO Fisheries Technical Paper, 361. [Google Scholar]
- Lecher AL, Katherine RMM, Paytan A. 2017. River and submarine groundwater discharge effects on diatom phytoplankton abundance in the Gulf of Alaska. Hydrology 61: 1–14. [Google Scholar]
- Lueangthuwapranit C, Sampantarak U, Wongsai S. 2011. Distribution and abundance of phytoplankton: influence of salinity and turbidity gradients in the Na Thap River, Songkhla Province, Thailand. J Coastal Res 27: 585–594. [CrossRef] [Google Scholar]
- Luu PT, Dung TTN, Thai TT, Yen NTM, Quang NX. 2017. Phytoplankton flora in correlation to environmental parameters in Ba Lai River, Ben Tre province. Vietnam Agric J Sci 15: 631–641. [Google Scholar]
- Majewska R, Adam A, Mohammad-Noor N, Convey P, Stefano M, Marshall DJ. 2017. Spatio-temporal variation in phytoplankton communities along a salinity and pH gradient in a tropical estuary (Brunei, Borneo, South East Asia). Trop Ecol 58: 251–269. [Google Scholar]
- McGowan S, Leavitt PR, Barker T, Moss B. 2020. Shallow water phytoplankton responses to nitrate and salinity enrichment may be modified by benthic processes. Inland Water 10: 137–151. [Google Scholar]
- Mez K, Hanselmann K, Preisig HR. 1998. Environmental conditions in high mountain lakes containing toxic benthic cyanobacteria. Hydrobiologia 368: 1–16. [CrossRef] [Google Scholar]
- Moisander PH, McClinton E III, Paerl HW. 2002. Salinity effects on growth, photosynthetic parameters, and nitrogenase activity in estuarine planktonic cyanobacteria. Microb Ecol 43: 432–442. [CrossRef] [PubMed] [Google Scholar]
- Pade N, Hagemann M. 2015. Salt acclimation of cyanobacteria and their application in biotechnology. Life 5: 25–49. [Google Scholar]
- Pakravan S, Akbarzadeh A, Sajjadi MM, Hajimoracloo A, Noori F. 2018. Chlorella vulgaris meal improved growth performance, digestive enzyme activities, fatty acid composition and tolerance of hypoxia and ammonia stress in juvenile Pacific white shrimp (Litopenaeus vannamei). Aquac Nutr 24: 594–604. [Google Scholar]
- Prado P, Caiola N, Ibanez C. 2017. Water management alters phytoplankton and zooplankton communities in Ebro delta coastal lagoons. Limnetica 36: 113–126. [Google Scholar]
- Pratiwi H, Damar A, Tiono S. 2018. Phytoplankton community structure in the Estuary of Donan River, Cilacap, Central Java, Indonesia. Biodiversitas 19: 2104–2110. [CrossRef] [Google Scholar]
- Radhakrishnan S, Saravana BP, Seenivasan C, Muralisankar T. 2015. Effect of dietary replacement of fishmeal with Chlorella vulgaris on growth performance, energy utilization and digestive enzymes in Macrobrachium rosenbegii postlarvae. Int J Fish Aquac 7: 62–70. [Google Scholar]
- Reinikainen M, Ketola M, Jantunen M, Walls M. 1995. Effects of Microcystis aeruginosa exposure and nutritional status on the reproduction of Daphnia pulex. J Plankton Res 17: 431–436. [CrossRef] [Google Scholar]
- Seymour EA. 1980. The effects and control of algae blooms in fish ponds. Aquaculture 19: 55–74. [CrossRef] [Google Scholar]
- Shirora A. 1996. The plankton of South Vietnam-Freshwater and marine plankton. Overseas Techinical Cooperation Agency, Japan. [Google Scholar]
- Sigaud TCS, Aidar E. 1993. Salinity and temperature effects on the growth and chlorophyll-a content of some planktonic algae. Bolm Inst oceanogr., S. Paulo 41: 95–103. [CrossRef] [Google Scholar]
- Stanca E, Roselli L, Cellamare M, Basset A. 2013. Phytoplankton composition in the coastal Magnetic Island lagoon, Western Pacific Ocean (Australia). Waters Bull 7: 145–158. [Google Scholar]
- Stefanidou N, Genitsaris S, Lopez‑Bautista J, Sommer U, Moustaka‑Gouni M. 2018. Effects of heat shock and salinity changes on coastal Mediterranean phytoplankton in a mesocosm experiment. Mar Biol 165:154 [CrossRef] [Google Scholar]
- Steinberg DK, Ruck KE, Gleiber MR, et al. 2015. Long-term (1993–2013) changes in macrozooplankton off the Western Antarctic Peninsula. Oceanogr Res Papers 101: 54–70. [CrossRef] [Google Scholar]
- Sunada K. 2009. Study on Asian River Basin. CREST Asian River Basins: Water Policy Study Team. [Google Scholar]
- Sy DT. 2005. Algae science. Ha Noi National University Publishing House. [Google Scholar]
- Tien DD, Hanh V. 1997. Freshwater algae of Vietnam. Vietnam Agricultural Publishing House. [Google Scholar]
- Tri LQ. 2016. The impact of climate change on agricultural production in the Mekong Delta. Vietnam J Sci Technol 8: 40–42. [Google Scholar]
- Tuan LA, Hoanh CT, Miller F, Sinh BT. 2007. Flood and salinity management in the Mekong delta, Vietnam. Challenges to sustainable development in the Mekong delta: Regional and national policy issues and research needs: Literature analysis. Bangkok, Thailand: The Sustainable Mekong Research Network (Sumernet), 15–68. [Google Scholar]
- Van MV, Dinh TD, Tuan NA. 2012. Species composition and density of plankton distributed in the coastal areas from Soc Trang to Bac Lieu. J Sci Can Tho Univ 23a: 89–99. [Google Scholar]
- Vicose GC, Viera MPP, Huchette S. 2012. Improving nursery performances of Haliotis tuberculata coccinea: Nutritional value of four species of benthic diatoms and green macroalgae germlings. Aquaculture 2012 (334–337): 124–131. [CrossRef] [Google Scholar]
- Xia S, Wang K, Wan L, Li A, Hu Q, Zhang C. 2013. Production, characterization, and antioxidant activity of fucoxanthin from the marine diatom Odontella aurita. Mar Drugs 11: 2667–2681. [CrossRef] [PubMed] [Google Scholar]
- Zahran E, Risha E. 2014. Modulatory role of dietary Chlorella vulgaris powder against arsenic-induced immunotoxicity and oxidative stress in Nile tilapia (Oreochromis niloticus). Fish Shellfish Immunol 41: 654–662. [Google Scholar]
- Zhang Q, Gradinger R, Spindler M. 1999. Experimental study on the effect of salinity on growth rates of Arctic-sea-ice algae from the Greenland Sea. Boreal Environ Res 4: 1–8. [Google Scholar]
Cite this article as: Nguyen TC, Au HV, Tran GT, Nguyen PT, Vu UN. 2022. Phytoplankton community composition variation under natural and prolonged saline intrusion simulations. Int. J. Lim. 58: 1
All Tables
The initial composition of phytoplankton in freshwater and seawater resources which used in two experiments.
All Figures
|
Fig. 1 Diagram of saline intrusion simulation experimental system. A regulated amount of seawater was used to bring each experimental tank to the target experimental salinity in 6 hours (Experiment 1) or at 5% increase per week (Experiment 2). Each treatment was conducted in triplicate. |
| In the text | |
|
Fig. 2 The species composition of phytoplankton at the end of both experiments. |
| In the text | |
|
Fig. 3 Cumulative dominance (%) and species rank of 4 phytoplankton phyla in Experiment 1 (a) and Experiment 2 (b). |
| In the text | |
|
Fig. 4 The structure of density of phytoplankton phyla at different treatments in Experiment 1. |
| In the text | |
|
Fig. 5 The structure of density of phytoplankton phyla at different treatments in Experiment 2. |
| In the text | |
Current usage metrics show cumulative count of Article Views (full-text article views including HTML views, PDF and ePub downloads, according to the available data) and Abstracts Views on Vision4Press platform.
Data correspond to usage on the plateform after 2015. The current usage metrics is available 48-96 hours after online publication and is updated daily on week days.
Initial download of the metrics may take a while.