Fig. 3
Download original image
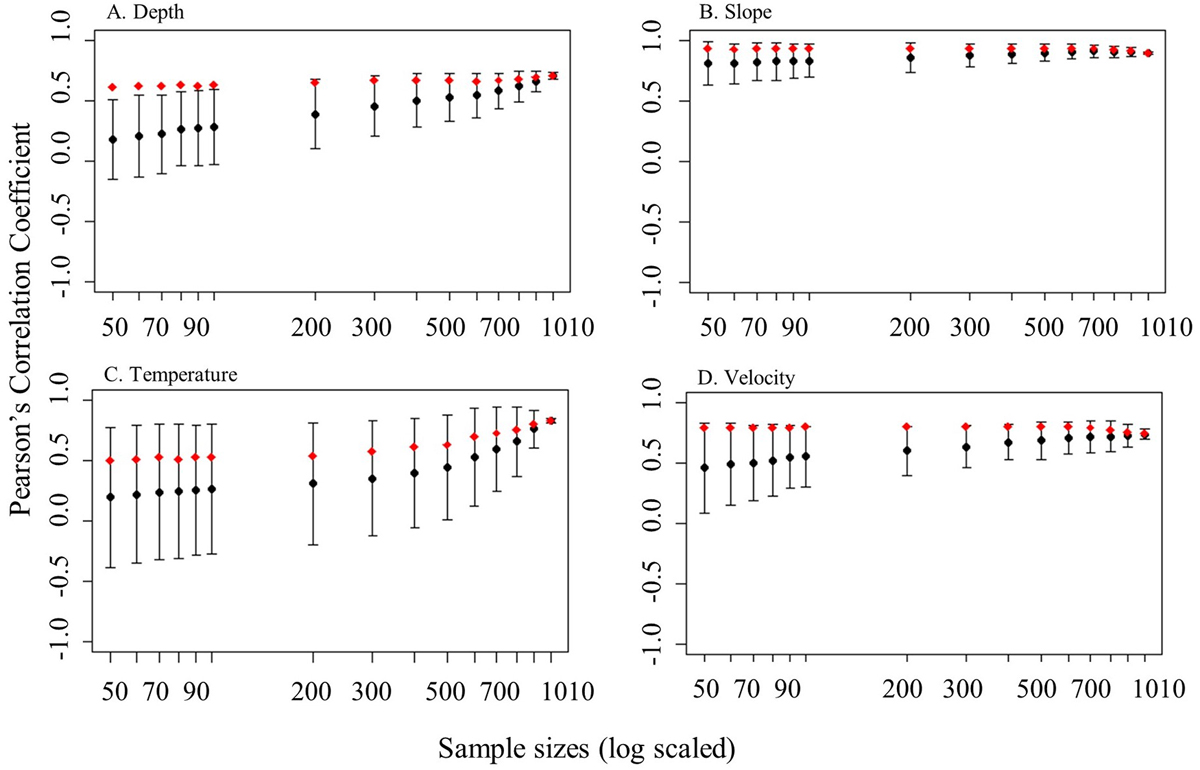
Pearson's correlation coefficient (PCC) of four environmental variables. The black plots showed the mean PCC of 1000 iterations of each sample size, and the top and bottom arrows indicated the ranges of mean ± standard deviation. The red plots indicated PCC of the averaged habitat suitability plots, and each value was shown also in Table 1.
Current usage metrics show cumulative count of Article Views (full-text article views including HTML views, PDF and ePub downloads, according to the available data) and Abstracts Views on Vision4Press platform.
Data correspond to usage on the plateform after 2015. The current usage metrics is available 48-96 hours after online publication and is updated daily on week days.
Initial download of the metrics may take a while.