| Issue |
Ann. Limnol. - Int. J. Lim.
Volume 57, 2021
|
|
|---|---|---|
| Article Number | 8 | |
| Number of page(s) | 10 | |
| DOI | https://doi.org/10.1051/limn/2021001 | |
| Published online | 18 March 2021 | |
Research Article
Habitat use of the Japanese eel (Anguilla japonica) and marbled eel (Anguilla marmorata) in the large subtropical Pearl River
1
Pearl River Fisheries Research Institute, Chinese Academy of Fishery Sciences, Guangzhou
510380, China
2
Université de Toulouse ‑ Paul Sabatier, 118 route de Narbonne, 31062 Toulouse Cedex, France
* Corresponding author: This email address is being protected from spambots. You need JavaScript enabled to view it.
Received:
27
July
2020
Accepted:
6
January
2021
Abstract
Anguilla spp. are catadromous fish and with a high economic value in Asia. The Pearl River is the largest river in southern China and is an important area for wild populations of Anguilla spp. However, until now, there has been little research on the eel's population structure and habitat use in the Pearl River. This study analyzed the population structure and habitat use characteristics of the Japanese eel (Anguilla japonica) and the marbled eel (Anguilla marmorata) in the Pearl River based on data collected from 2015 to 2018. A total of 181 Japanese eels and 56 marbled eels were collected, over half of which were middle-sized eels between 255 and 600 mm in length. Although they are sister species, Japanese eels mainly inhabit complex river habitats characterized by high river fractals and coefficients of fluvial facies, while marbled eels mainly inhabit wider and deeper river sections. The impact of physical environmental factors (such as river fractals, coefficients of fluvial facies and river width) on the distribution of these two species is greater than the impact of small-scale water quality environmental factors (such as DO concentration, temperature and clarity). The results of this study showed that wild Anguilla spp. resources in the Pearl River were extremely low and there was an urgent need for conservation and management of eel resources in south China.
Key words: Japanese eel / marbled eel / body size / habitat preference / Pearl River
© EDP Sciences, 2021
1 Introduction
The Japanese eel (Anguilla japonica) and marbled eel (Anguilla marmorata) are important migratory fish of high commercial importance. These two species support a valuable commercial fishery in Asia, generally for both human consumption and aquaculture (Shiao et al., 2003). However, local populations of these species have been suffering from long-term degradation due to the construction of dams, habitat loss and overfishing (Tatsukawa, 2003; Chang et al., 2018). In addition, the middle-sized eels required for aquaculture are harvested from wild populations, as it is not possible to commercially breed this species in captivity currently (Tanaka et al., 2003; Tanaka, 2015). This results in a sharp decrease in young eels in wild populations, leading to the exhaustion of wild populations. The average annual eel catch in Japan fell from 130 tons/year in the 1960s to 7 tons/year in the 1990s (Tatsukawa, 2003). In order to maintain wild populations and to effectively protect eels as a resource, it is necessary to research wild populations and their habitat preference characteristics to gain a better understanding of this species.
The management and conservation of fish populations requires information on their distribution and habitat use (Jackson et al., 2001; Matthiopoulos, 2003). It is recognized that habitat loss and the obstruction of migration routes by dams are the main factors leading to a sharp decline in eel populations (Feunteun, 2002; Dekker, 2000; Laffaille et al., 2003; Chen et al., 2014). Understanding habitat use can help to quantify the inherent needs of animals, as expressed in the environment in which they are observed (Manly et al., 2002). The habitat use of fish populations mainly result from the heterogeneity of environmental factors on spatial and temporal scales, and is a comprehensive reflection of various environmental factors (human disturbance, geographic climate, hydrological factors, river size, etc.) (Oberdorff et al., 2001; Kadye et al., 2008). Research focusing on fish assemblages and their relationship with selected habitat features has important practical significance, both for the protection and utilization of fishery resources. In recent years, spatial analysis of different protection objects has become an indispensable research tool in conservation ecology (Brennan et al., 2019). A detailed understanding of the spatial distribution characteristics of natural wild resources, identifying habitat utilization and its influencing factors are not only the basis for the establishment of population protection areas, but also the premise for the sustainable development of wild eel resource conservation and aquaculture.
The density and habitat use of freshwater fish can be simultaneously influenced by complex interactions of biotic and abiotic processes operating over a variety of spatial and temporal scales (e.g. Esselman and Allan, 2010; Matis et al., 2018). Fish population distribution and habitat selection can be determined by factors such as depth, velocity, substrate and cover (e.g. Rosenfeld et al., 2011) and dams (Joy and Death, 2001). It has been found that water flow velocity, dissolved oxygen (DO) concentration, water temperature and organic matter content are important factors affecting the spatial heterogeneity of fish communities in rivers (Kouamélan et al., 2003). For example, changes in river hydrology can affect fish feeding strategies and therefore habitat choice (Castello et al., 2019; Kume et al., 2020; Matsushige et al., 2020). Studies have also shown that river morphological characteristics and complexity, such as water depth, riverbed sediment type, slope and river width, are key factors affecting the spatial distribution and habitat use of fish (Ornellas and Coutinho, 1998; Kouamélan et al., 2003; Kume et al., 2019, 2020; Kumai et al., 2020; Matsushige et al., 2020).
Numerous studies have shown that eel populations can differ in their habitat use (Wiley et al., 2004). Factors such as water velocity and fish density explained patterns in the size-distribution of longfin eels (Anguilla dieffenbachia), while the size-distribution of shortfin eels (Anguilla australis) was strongly related to landscape-scale variables such as distance from sea and channel slope (Booker and Graynoth, 2013). Different life history stages of the anguillia species can have different habitat use. For example, small eels (generally <150 mm) are often confined to downstream areas, while larger eels are distributed further inland (Laffaille et al., 2004). Channel width, silt depth, and the density of plants also influence the density and distribution of eels (Lasne and Laffaille, 2008; Itakura et al., 2020).
There is limited information available regarding the abundance and distribution of Japanese eels and marbled eels in China (Smogor et al., 1995; Broad et al., 2001), with the exception of the Japanese eel in the Yangtze Estuary in China (Zhang et al., 2008) and Taiwan (Han and Tzeng, 2006; Tseng et al., 2012). There have been few studies on the spatial distribution of eels, despite their utilization of many different habitat types. The Pearl River is the largest river in southern China. It is ideally located to receive glass eel recruits after their oceanic migration and is an important wild gene pool resource for growing and rearing eels (Shuai et al., 2015). Until now, there has been little or no information available on the status of eels and their habitat in the Pearl River. Given the sharp decline in eel abundance globally (Sala et al., 2000; Ibbotson et al., 2002), an understanding of their interactions with the freshwater habitat is a critical step towards effectively managing, conserving, and restoring eel resources (Bosman et al., 2011).
Using survey results from 13 sites in the Pearl River Basin from 2015 to 2018, this study conducted a preliminary analysis of the current status, habitat preference characteristics and environmental factors impacting eel populations, in order to provide protection and management of wild eel resources in the Pearl River system. The specific objectives of this study were to (1) determine the population size of the Japanese eel and marbled eel in the Pearl River, (2) to understand their habitat use according to size, and (3) to quantify the spatial distribution of eel assemblages relative to environmental variations to provide support for the management and the restoration of eel populations and habitats. Understanding the population status and habitat utilization of wild eels is a prerequisite for the conservation and utilization of eel resources in south China.
2 Materials and methods
2.1 Study area
The Pearl River is the largest river in southern China. It is 2217 km long and is located at E97°39′ ∼ E117°18′, N3°41′∼ N29°15′. The Pearl River is characterized by having an average temperature of 23 °C and is an important area for sustainable wild fishery resources due to the convergence of fresh and seawater creating a brackish environment. The Pearl River Estuary contains a large amount of nutrients and source elements from the terrestrial environment. According to historical data (Lu, 1990), Japanese eels can migrate as far as the Hongshuihe River. Therefore, this study was conducted along the main stem of the Pearl River from the upstream point of eel migration (S13, Heshan sampling site, Hongshuihe river, about 800 km from the estuary) to downstream of the Pearl River Estuary in southern China (Fig. 1). The 13 sampling sites were established to provide a broad spatial coverage of the migratory route of eels in the Pearl River (Tab. 1).
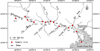 |
Fig. 1 Sampling sites. |
Details of sampling sites located along the main stem of the Pearl River.
2.2 Data collection
Samples were collected eight times a year (twice a season) at each sampling site from 2015 to 2018. Specimens of eels were collected using a combination of complementary approaches including five fishing hooks (length: 20 m, hooks: 50) and ten lobster pots (length: 15 m, radius: 18 cm). Sampling was performed using the same protocol at each site, with one site being sampled per day. At all sites, sampling started in the early evening (approximately 18:00 h) and lasted for 12 h throughout the night. Captured individuals were immediately photographed, identified, logged, measured and weighed. Total length (TL) was measured to the nearest 1 mm and wet body weight (BW) was recorded to the nearest 0.1 g.
Water temperature (°C), DO (µmol ∙ L‑1), NH3-N (mg ∙ L‑1) and total dissolved solids (TDS, g ∙ L‑1) were selected as water quality environmental parameters of the local habitat. These parameters were measured twice a month at each sampling site with a portable multi-parameter water quality instrument (YSI 6600). Water clarity (cm) was measured using a Secchi disk. Flow velocity (m ∙ s‑1) data were provided by the Pearl River Hydraulic Research Institute.
In this study, river fractal characteristics and coefficients of fluvial facies (C) were selected as river morphological factors of local fish habitat. Fractal geometry concepts have been widely applied as a tool for describing complex natural phenomena, such as the physics of rivers (Janik et al., 2016). The fractal dimension of the river reflects the complexity of the river habitat to some extent. Based on a 10-km grid map over the Pearl River basin, the river fractal dimensions were computed by the widely used box-counting method (Liu et al., 2018). The box sizes used in this study were 10, 8, 6, 4, 2, and 1 km. The river fractals were calculated in ArcGIS 10.2. The coefficient of fluvial facies represents the space and complexity where the fish community can freely move, and is defined ass  , where W represents average river width and D represents average river depth. Values for W and D were provided by the Pearl River Hydraulic Research Institute.
2.3 Statistical analyses
Many studies have demonstrated that different life stages within a species can have different habitat use and intraspecific variability in habitat preference is not negligible when analyzing how environmental variables affect eel populations (Broad et al., 2001; Laffaille et al., 2004; Booker and Graynoth, 2013). Therefore, the eels in this study were divided into three classes: small-sized eels (body length ≤ 255 mm), middle-sized eels (body length 255–600 mm) and large-sized eels (body length ≥ 600 mm) based on body size (Matsushige et al., 2020).
Non-metric multidimensional scaling (nMDS) is an ordination method that simplifies the research object (sample or variable) of multidimensional space into low dimensional space for analysis and classification, while preserving the original relationship between objects. It is applicable to situations where accurate similarity or dissimilarity data between research subjects is not available, and only hierarchical relationship data can be obtained (Legendre and Legendre, 2012). NMDS uses rank orders instead of use the absolute abundances of species in communities, and thus is an extremely flexible ordination method and is widely used in different ecosystems (Matthaei et al., 2010). In this study, we first defined the original positions of communities in multidimensional space and constructed an initial configuration of the samples in 2-dimensions. Then we determined the stress between 2-D configuration and predicted values from the regression based on the regress distances against the observed distances. The extent to which the points on the 2-D configuration differ from this monotonically increasing line determines the degree of stress. If stress is high, reposition the points in 2-dimensions in the direction of decreasing stress, and repeat until stress <0.1. To begin, we treat sites with the same number of absent species as more similar because nMDS sensitive to species absences.
Redundancy analysis (RDA) is a method to extract and summarise the variation in a set of response variables that can be explained by a set of explanatory variables. More accurately, RDA is a direct gradient analysis technique which summarises linear relationships between components of response variables that are explained by a set of explanatory variables. RDA extends multiple linear regression (MLR) and principal components analysis (PCA). It generates one ordination in the space defined by the matrix of response variables and another in the space defined by the matrix of explanatory variables (Legendre and Legendre, 2012) and is widely used to identify the different roles of explanatory and response variables (Angeler et al., 2009).
In this study, the distribution pattern of eels was evaluated by nMDS. A Bray-Curtis similarity matrix was used in the construction of a two-dimensional non-metric nMDS (Legendre and Legendre, 2012). And non-parametric Kruskal-Wallis multiple comparison was used to test the eel abundance and biomass difference among groups. RDA was then applied to determine how environmental variables affected eel assemblages and to outline the specific environmental variables that were most strongly related to eel assemblages based on the abundance of the different life stages. Analysis of variance (ANOVA) permutation tests (randomly replicated 1000 times) were performed to evaluate the model's performance and significance of constraints (Angeler et al., 2009).
All analyses were conducted using R-3.6.1 Statistical Software (R Core Development Team, 2011).
3 Results
3.1 Population structure
A total of 181 Japanese eel were collected during the present study. Total length ranged from 212 mm to 920 mm, with a mean value of 505 ± 104 mm. Mean wet weight was 403 ± 141 g, and ranged from 25 g to 996 g. A total of 56 marbled eel were collected during this study. Total length ranged from 370 mm to 969 mm, with a mean value of 522 ± 151 mm. Wet weight ranged from 179 g to 4200 g, with a mean value of 520 ± 181 g (Tab. 2). Over half of the Japanese eels (58.2%) and marbled eels (53.7%) collected were middle-sized eels between 255 and 600 mm total length. Both large-sized Japanese eels and marbled eels were very scarce (Fig. 2), and the frequency of occurrence (percentage of sampling sites where eels were present) was less than 1% for both species. The largest Japanese eel collected in this study was in the brackish water at the Zhuhai sampling site (S1) while the biggest marbled eel was collected at the Deqing sampling site (S5).
Population structure of eels collected from sampling locations in the Pearl River.
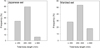 |
Fig. 2 Length distribution of Japanese eels and marbled eels collected at sampling sites in the Pearl River between 2015 and 2018. |
3.2 Spatial distribution patterns of eels
The spatial distribution characteristics of Japanese eels and marbled eels shared some similarities. For example, the majority of individuals of both species were mainly distributed in the Guiping-Shilong area (S10, S11, S12), and followed by the Deqing-Feikai area (S5–S6) (Fig. 3). However, the smallest numbers of Japanese eel were recorded in the upstream Heshan area (S13) and in the downstream Zhaoqing-Xiaotang area (S3–S4). Some Japanese eels were recorded in the estuary area, but no marbled eels were collected in the estuary or adjoining areas.
The largest Japanese eel (total length 920 mm) was collected in the estuarine Zhuhai sampling site (S1), and the smallest individual (total length 212 mm) was collected in the Wuxuan River area of the Xijiang River. While the largest marbled eel individual (total length 969 mm) was collected at the Deqing sampling site (S5), and the smallest individual (total length 370 mm) was collected in the Guiping River area.
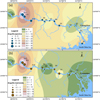 |
Fig. 3 Spatial patterns of Japanese eel (a) and marbled eel (b) populations in the Pearl River. The circle size represents the size of the eel population. Color contour represents the isoline of the spatial distribution of eel population. |
3.3 Eel assemblage analysis
The nMDS analyses identified three separate groups of Japanese eel (stress value = 9.405141e-04, Fig. 4a) and marbled eel (stress value = 4.368721e-05, Fig. 4b). There were significant differences in the distribution characteristics of population age structures of eels between different river sections, although spatial autocorrelation existed among the sites tested. Discrete groups were extracted using the Bray-Curtis dissimilarity matrix to quantify the compositional dissimilarity between sites. The spatial distribution of the population age structure of Japanese eel and marbled eel has certain similarities and differences.
For Japanese eels, Group 1 was composed of samples from two sites in the estuary (S1 and S2). This group was distinct from other group locations and this area is characterized by brackish water and is the location from where mature eels migrate to the south China sea, at the beginning of Autumn. Group 2 consisted of eight samples taken from the middle-lower mainstream sites and an upstream site (S3, S4, S5, S6, S7, S8, S9 and S13). Group 3 primarily consisted of samples from upstream areas, with a high abundance of eels of all age groups, that were restricted by the presence of several large dams. For marbled eels, Group 1 was composed of samples from sites in the estuary, downstream and upstream sites (S1, S2, S3, S4 and S13), characterized by their location in proximity to industrial activities and the presence of low numbers of marbled eels. Group 2 consisted of four samples taken from midstream sites (S6, S7, S8 and S9). Group 3 consisted of four samples with a high population abundance evenly distributed across all ages (S5, S10, S11 and S12).
Eel abundance and biomass differed significantly among groups according to the non-parametric Kruskal-Wallis test (P < 0.05). For Japanese eels, Group 3 had the highest abundance and group 1 had the highest biomass. Although Group 3 had a high abundance, it had lower biomass compared with group 1, indicating that the majority of individuals in this group were middle-sized eels. For marbled eel, Group 3 had the highest abundance and biomass. Group 1 had the lowest abundance and biomass, much higher than group 1 and group 2 (Fig. 5).
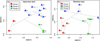 |
Fig. 4 Ordination of population age structures of Japanese eels (a) and marbled eels (b) in a two-dimensional non-metric multidimensional scaling configuration. A dendrogram was used to illustrate the clustering of groups. Different symbols (and colors) denote respective groups. |
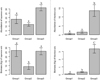 |
Fig. 5 Variation in eel abundance and biomass for each group. Bars represent standard error, letters “a”, “b” and “c” represent difference. |
3.4 Relationships between eels assemblages and environmental factors
The combined effect of the first two canonical axes explain 85.81% of the total variance of the data, with the first axis alone accounting for 60.68%. The P value (ANOVA test) of the first two canonical axes was sufficiently low to denote a good sample separation along the axis. The eigenvalues and their contribution to variance are shown in Table 3. The RDA triplot (scaling = 2) showed that river fractals, salinity and NH3-N explained the largest portion of variance along the RDA1 axis. Coefficients of fluvial facies, river width and water depth explained the largest portion of variance along the RDA2 axis (Fig. 6).
Japanese eel and marbled eel are sister species and their spatial distribution in the Pearl River has same spatial correlation, however their distribution is also affected by different environmental factors. Permutation tests with 1,000 iterations were performed and found that the spatial assemblage of small-sized Japanese eel preferred water with high salinity. Large-sized Japanese eel preferred habitats with high river fractals and salinity. Both middle-sized Japanese eels and marbled eels preferred habitats characterized by high coefficients of fluvial facies, high river fractals and river depth. Small-sized and large-sized marbled eel preferred deeper and wider rivers. Generally, the impact of physical environmental factors (such as river fractals, coefficients of fluvial facies and river width) on the distribution of these two species was greater than the impact of small-scale water quality environmental factors (such as DO concentration, temperature and clarity).
Summary of the RDA analysis.
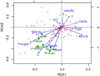 |
Fig. 6 Redundancy analysis triplot showing relationships among eel assemblages and environmental variables (scaling 2). Green triangles represent different life stages of Japanese eels. Green circles represent different life stages of marbled eels. Environmental variables are represented by blue arrows. Solid lines depict significant environmental factors as opposed to dashed lines which are not significant. Red crosses represent number of eels collected at each sampling site. |
4 Discussion
The Japanese eel is one of the most widely distributed and cultured fish in the world. Its ubiquitous nature has meant that the decline in the abundance of this species has gone unnoticed for a long time (Jacoby and Gollock, 2014). Marbled eel is a large eel species and although it is widely distributed, its population is small (Robinet et al., 2003). The resource of middle-sized eels in Pearl River Estuary in 2013 was about 893.88 × 10⁴ ind. (Shuai et al., 2015). During the sampling period from 2015 to 2018, only 181 Japanese eels and 56 marbled eels were collected. This showed that most of the middle-sized eels did not enter into the Pearl River system to grow into adults, and raises concern regarding eel resources. Although the investigation period was limited, according to the principle that the larger number of species the higher frequency have been collected, it also showed that the eel resources were scarce in the Pearl River system and there was an urgent need to establish a targeted protection system.
According to historical data (Lu, 1990), Japanese eels can migrate to the Hongshuihe River area, but in this study, only one Japanese eel was collected in the Heshan River section of the Hongshuihe River, which was far less than numbers collected in the middle and lower reaches. This indicated that the spatial distribution of the Japanese eel have changed and that their migration route has reduced in comparison with historical data (Lu, 1990).
The results of the current study also showed that the habitat use and spatial distribution of the population age structure of Japanese eels and marbled eels had some differences, although they are sister species that were both mainly distributed in the Guiping − Shilong sections of the Pearl River (S10, S11, S12). These sites had the highest abundance and biomass of eels. This may be due to the increase in stream complexity and/or habitat diversity in the Guiping-Shilong section, in addition to increased food availability in this area (Wiley et al., 2004). More importantly, numerous dams were located upstream of these sites (such as the Yantan Dam with an installed capacity of 1,810 MW, the Dahua Dam with an installed capacity of 566 MW, the Bailongtan Dam with an installed capacity of 192 MW, and the Letan Dam with an installed capacity of 600 MW) and prevented eels moving further upstream (Shuai et al., 2017). These results are in keeping with the findings of other studies where high eel densities were found in areas immediately downstream of dams (Feunteun et al., 1998). These power stations block eel migration and affect their spatial distribution, which in turn leads to a reduction in abundance (Hitt et al., 2012; Turner et al., 2018). There is evidence that dams, which act as barriers to migration, slow the colonization of upstream reaches by eels (Lasne and Laffaille, 2008). Dams may have important impacts on the abundance and size structure of eels at a local scale, notably because they restrain the distribution of small colonizing eels that are sensitive to density-dependent mechanisms (Feunteun et al., 2002) and young eels (<3 years) are more seriously influenced by the number of dams than older eels (Briand et al., 2005).
The results of the current study also suggested that there were significant differences in the distribution characteristics of age groups in eel populations due to environmental variables. Generally, eel populations were positively associated with environmental factors characterized by the complexity of river habitats, such as river fractals, coefficients of fluvial facies, river depth and river width (Shuai et al., 2020). The impact of physical environmental factors on the distribution of these two species was greater than the impact of small-scale water quality (such as DO concentration, water temperature and clarity). Specifically, river fractals, coefficients of fluvial facies and salinity were the main factors affecting the spatial distribution of Japanese eels, while water depth and river width were the main factors affecting the distribution of marbled eels. River fractals and coefficients of fluvial facies indicated the complexity of river morphology, while the width and depth of the river represent the volume of free movement for fish, which meant that Japanese eels mainly inhabited wide river sections with complex habitats marbled eels mainly inhabited larger and wider sections of river.
In addition, large-sized Japanese eel preferred habitats with high river fractals and salinity, while middle-sized Japanese eels and marbled eels preferred habitats characterized by high coefficients of fluvial facies, high river fractals and river depth. However, small-sized and large-sized marbled eel both preferred wider and deeper rivers. The spatial assemblage of small-sized Japanese eels preferred rivers with high salinity, while small-sized marbled eel preferred wider and deeper rivers. No marbled eels were recorded in the estuary or adjoining areas in the current study. The distribution of marbled eels recorded in the current study was not in keeping with that reported by Joy and Death (2001) and Ibbotson et al. (2002) who reported that eel distributions were strongly correlated with distance from the sea. The results of the current study were also not consistent with the claim that migratory behaviour decreases as eels grow (Feunteun et al., 2002), where small eels mainly settled in the first available and suitable habitats while large eels were mainly sedentary and settled in a home range, although some remain “nomadic” and move to upstream reaches.
Habitat preference in eels is a function of long-term evolution and selection of the organism and many environmental factors, including anthropogenic activity, geoclimatic region and hydrologic regime (Oberdorff et al., 2001; Pyron and Lauer, 2004). Stream complexity may be important factor to facilitate resting and hiding by eels, and provides a varied habitat for large numbers of fish, providing food sources for eels (Li et al., 2012; Kume et al., 2020; Matsushige et al., 2020). River width and river depth affect the volume of eels that can freely move at the sampling location. Wider rivers are associated with increased space utilization by eels, and living space is an important factor affecting the spatial distribution of fish (Wiley et al., 2004). The habitat preference of Japanese eels and marbled eels are consistent with European eels (Laffaille et al., 2004) and American eels (Boivin et al., 2015), both of which prefer deeper habitats. However, in the present study, the distribution of Japanese eels and marbled eels showed no relationship with water velocity, which differred from the results of previous studies that have shown that longfin eels (Jellyman et al., 2003) and marbled eels (Kumai et al., 2020) have greater preferences for higher water velocities while shortfins (Jellyman et al., 2003) and Japanese eel (Kume et al., 2020) prefer slower-flowing water.
In recent years, the issue of eel resources and their protection has attracted a great deal of attention internationality due to the sharp decline in global eel resources (Dekker, 2003; Tsukamoto et al., 2006; Sullivan et al., 2006; Tsukamoto et al. 2020). The European Commission has formulated eel protection plans, such as the Washington Convention on Protection. While the EU has suspended the import and export of plutonium and eel derivatives to protect eel resources since 2011 (https://jncc.gov.uk). Based on the results collected at sampling stations along the length of the Pearl River basin from 2015 to 2018, this study described the resource status and spatial distribution characteristics of eels in the Pearl River for the first time. It also provided important information for the conservation of wild eel fishery resources. Continued monitoring and analysis of the eel resource in the Pearl River is the next step in this research area.
Acknowledgements
This study was supported by the National Natural Science Foundation of China (General Program NO.31870527), the China-ASEAN Maritime Cooperation Fund and the Science and Technology Program of Guangzhou, China (NO.201804010487).
References
- Angeler DG, Viedma O, Moreno JM. 2009. Statistical performance and information content of time lag analysis and redundancy analysis in time series modeling. Ecology 90: 3245–3257. [CrossRef] [PubMed] [Google Scholar]
- Brennan SR, Cline TJ, Schindler DE. 2019. Quantifying habitat use of migratory fish across rivers capes using space-time isotope models. Methods Ecol Evol 10: 1036–1047. [Google Scholar]
- Boivin B, Castonguay M, Audet C, Pavey SA, Dionne M, Bernatchez L. 2015. How does salinity influence habitat selection and growth in juvenile american eels anguilla rostrata? J Fish Biol 86: 765–784. [CrossRef] [PubMed] [Google Scholar]
- Booker DJ, Graynoth E. 2013. Relative influence of local and landscape-scale features on the density and habitat preferences of longfin and shortfin eels. New Zeal J Mar Fresh 1: 1–20. [Google Scholar]
- Bosman SH, Methven DA, Courtenay SC, Hanson JM. 2011. Fish assemblages in a north Atlantic coastal ecosystem: Spatial patterns and environmental correlates. Estuar Coast Shelf S 92: 232–245. [Google Scholar]
- Briand C, Fatin D, Fontenelle G, Feunteun E. 2005. Effect of re-opening of a migratory pathway for eel (Anguilla anguilla, L.) at a watershed scale. B F Peche Piscic 378: 67–86. [Google Scholar]
- Broad TL, Townsend CR, Closs GP, Jellyman DJ. 2001. Microhabitat use by longfin eels in New Zealand streams with contrasting riparian vegetation. J Fish Biol 59: 1385–1400. [Google Scholar]
- Castello L, Bayley PB, Fabre NN, Batista VS. 2019. Flooding effects on abundance of an exploited, long-lived fish population in river-floodplains of the Amazon. Rev Fish Biol Fisher 29: 487–500. [Google Scholar]
- Chang YK, Miyazawa Y, Miller MJ, Tsukamoto K. 2018. Potential impact of ocean circulation on the declining Japanese eel catches. Sci Rep 5496. [PubMed] [Google Scholar]
- Chen JZ, Huang SL, Han YS. 2014. Impact of long-term habitat loss on the Japanese eel Anguilla japonica . Estuar Coast Shelf Sci 151: 361–369. [Google Scholar]
- Dekker W. 2000. A Procrustean assessment of the European eel stock. ICES J Mar Sci 57: 938–947. [Google Scholar]
- Dekker W. 2003. Worldwide decline of eel resources necessitates immediate action: Quabec Declaration of Concern. Fisheries 12: 28–30. [Google Scholar]
- Esselman PC, Allan JD. 2010. Relative influences of catchment- and reach-scale abiotic factors on freshwater fish communities in rivers of northeastern Mesoamerica. Ecol Freshw Fish 19: 439–454. [Google Scholar]
- Feunteun E, Accou A, Guillouët J, Laffaille P, Legault A. 1998. Spatial distribution of an eel population (Anguilla anguilla L.) in a small coastal catchment of northern Brittany (France). Consequences of hydraulic works. Knowl Manag Aquat Ecol 349: 129–139. [Google Scholar]
- Feunteun E. 2002. Management and restoration of the European eel population (Anguilla anguilla): an impossible bargain? Ecol Eng 18: 575–591. [Google Scholar]
- Han YS, Tzeng WN. 2006. Use of the sex ratio as a means of resource assessment for the Japanese eel Anguilla japonica: a case study in the Kaoping River, Taiwan. Zool Stud 45: 255–263. [Google Scholar]
- Hitt NP, Eyler S, Wofford JEB. 2012. Dam removal increases American eel abundance in distant headwater streams. Trans Am Fish Soc 141: 1171–1179. [Google Scholar]
- Ibbotson I, Smith J, Scarlett P, Aprahamian MW. 2002. Colonisation of freshwater habitats by the European eel Anguilla anguilla . Freshw Biol 47: 1696–1706. [Google Scholar]
- Itakura H, Wakiya R, Sakata MK, Hsu HY, Minamoto T. 2020. Estimations of riverine distribution, abundance, and biomass of anguillid eels in Japan and Taiwan using environmental DNA analysis. Zool Stud 59. [Google Scholar]
- Jackson DA, Peres-Neto PR, Olden JD. 2001. What controls who is where in freshwater fish communities-the roles of biotic, abiotic, and spatial factors. Can J Fish Aquat Sci 58: 157–170. [Google Scholar]
- Jacoby D, Gollock M. 2014. Anguilla japonica. The IUCN Red List of Threatened Species Version, 2015–3. [Google Scholar]
- Janik G, Olszewska B, Pywaczyk L, Lyczko W, Albert M, Nowicka E. 2016. Applicability of geostatistical tools and fractal theory for the estimation of the effect of a river on water relations in adjacent area. River Res Appl 32: 1342–1354. [Google Scholar]
- Jellyman DJ, Bonnett ML, Sykes JRE, Johnstone P. 2003. Contrasting use of daytime habitat by two species of freshwater eel (Anguilla spp.) in New Zealand rivers. Am Fish Soc Symp 63–78. [Google Scholar]
- Joy MK, Death RG. 2001. Control of freshwater fish and crayfish community structure in Taranaki, New Zealand: dams, diadromy or habitat structure? Freshw Biol 46: 417–429. [Google Scholar]
- Kadye WT, Magadza CHD, Moyo NAG, Kativu, S. 2008. Stream fish assemblages in relation to environmental factors on a montane plateau (Nyika Plateau, Malawi). Environ Biol Fish 83: 417–428. [Google Scholar]
- Kouamélan EP, Teugels GG, N′Douba V, Bi GG, Koné T. 2003. Fish diversity and its relationships with environmental variables in a West African basin. Hydrobiologia 505: 139–146. [Google Scholar]
- Kumai Y, Tsukamoto K, Kuroki M. 2020. Growth and habitat use of two anguillid eels, Anguilla marmorata and A. japonica, on Yakushima Island, Japan. Ichthyol Res 67: 375–384. [Google Scholar]
- Kume M, Terashima Y, Wada T, Yamashita Y. 2019. Longitudinal distribution and microhabitat use of young Japanese eel Anguilla japonica in a small river flowing through paddy areas. J Appl Ichthyol 35: 876–883. [Google Scholar]
- Kume M, Terashima Y, Kawai F, Kutzer A, Wada T, Yamashita Y. 2020. Size-dependent changes in habitat use of Japanese eel Anguilla japonica during the river life stage. Environ Biol Fish 103: 269–281. [Google Scholar]
- Laffaille P, Feunteun E, Baisez A, Robinet T, Acou A, Legault A, Lek S. 2003. Spatial organisation of European eel (Anguilla anguilla L.) in a small catchment. Ecol Freshw Fish 12: 254–264. [Google Scholar]
- Laffaille P, Baisez A, Rigaud C, Feunteun E. 2004. Habitat preferences of different European eel size classes in a reclaimed marsh: a contribution to species and ecosystem conservation. Wetlands 3: 642–651. [Google Scholar]
- Lasne E, Laffaille P. 2008. Analysis of distribution patterns of yellow European eels in the Loire catchment using logistic models based on presence-absence of different size-classes. Ecol Freshw Fish 1: 30–37. [Google Scholar]
- Legendre P, Legendre LFJ. 2012. Numerical Ecology. Third English edition. Amsterdam, The Netherlands: Elsevier Science. [Google Scholar]
- Li J, Huang L, Zou L, Kano Y, Sato T, Yahara T. 2012. Spatial and temporal variation of fish assemblages and their associations to habitat variables in a mountain stream of north Tiaoxi River, China. Environ Biol Fish 93: 403–417. [Google Scholar]
- Liu Q, Zhang YL, Shen H, Zhao ZG, Li HJ. 2018. Fractal characteristics and quantitative descriptions of messily grown nanowire morphologies. Mater Design 153: 287–297. [Google Scholar]
- Lu KX. 1990. Pearl River Fishery Resources. Guanghzou: Guangdong Science and Technology Press 91–121. [Google Scholar]
- Manly BFJ, McDonald LL, Thomas DL, McDonald TL, Erickson WPL. 2002. Resource selection by animals: statistical design and analysis for field studies, 2nd ed. Chapman and Hall. [Google Scholar]
- Matis PA, Donelson JM, Bush S, Fox RJ, Booth DJ. 2018. Temperature influences habitat preference of coral reef fishes: Will generalists become more specialised in a warming ocean? Glob Chang Biol 24: 3158–3169. [PubMed] [Google Scholar]
- Matthaei CD, Piggott JJ, Townsend CR. 2010. Multiple stressors in agricultural streams: interactions among sediment addition, nutrient enrichment and water abstraction. J Appl Ecol 47: 639 –649. [Google Scholar]
- Matsushige K, Yasutake Y, Mochioka N. 2020. Spatial distribution and habitat preferences of the Japanese eel, Anguilla japonica, at the reach and channel‑unit scales in four rivers of Kagoshima Prefecture, Japan. Ichthyol Res 67: 68 – 80. [Google Scholar]
- Matthiopoulos J. 2003. Model-supervised kernel smoothing for the estimation of spatial usage. Oikos 102: 367–377. [Google Scholar]
- Oberdorff T, Hugueny B, Vigneron T. 2001. Is assemblage variability related to environmental variability? An answer for riverine fish. Oikos 93: 419–428. [Google Scholar]
- Ornellas AB, Coutinho R. 1998. Spatial and temporal patterns of distribution and abundance of a tropical fish assemblage in a seasonal Sargassum bed, Cabo Frio Island, Brazil. J Fish Biol 53: 198–208. [Google Scholar]
- Pyron M, Lauer TE. 2004. Hydrological variation and fish assemblage structure in the middle Wabash River. Hydrobiologia 525: 203–213. [Google Scholar]
- Rosenfeld JS, Campbell K, Leung ES, Bernhardt J, Post J. 2011. Habitat effects on depth and velocity frequency distributions: implications for modeling hydraulic variation and fish habitat suitability in streams. Geomorphology 130: 127–135. [Google Scholar]
- Robinet T, Guyet S, Marquet G, Mounaix B, Olivier JM, Tsukamoto K, Valade P, Feunteun E. 2003. Elver invasion, population structure and growth of marbled eels Anguilla marmorata in a tropical river on Ŕeunion Island in the Indian Ocean. Environ Biol Fish 68: 339–348. [Google Scholar]
- Sala OE, Chapin FS, Armesto JJ, Berlow E, Bloomfield J, Dirzo R, Huber-Sanwald E, Huenneke LF, Jackson RB, Kinzig A, Leemans R, Lodge DM, Mooney HA, Oesterheld M, Poff MT, Sykes BH, Walker M, Wall DH. 2000. Global biodiversity scenarios for the year 2100. Science 287: 1770–1774. [Google Scholar]
- Shiao JC, Iizuka Y, Chang CW, Tzeng WN. 2003. Disparities in habitat use and migratory behavior between tropical eel Anguilla marmorata and temperate eel A. japonica in four Taiwanese rivers. Mar Ecol Prog Ser 261: 233–242. [Google Scholar]
- Shuai FM, Li ZQ, Liu GW, Li XH, Li YF, Yang JP, Li J. 2015. Resource status of Japanese eel (Anguilla japonica) in the Pearl River Estuary. South China Fish Sci 11: 85–92. [Google Scholar]
- Shuai FM, Li XH, Chen FC, Li YF, Lek S. 2017. Spatial patterns of fish assemblages in the Pearl River, China: environmental correlates. Fund Appl Limnol 189: 329–340. [Google Scholar]
- Shuai FM, Liu QF, Liu YQ, Yang WL, Lek S, Chen YS. 2020. Spatial Distribution Patterns of Japanese Eel (Anguilla japonica) in a Large Subtropical River (Pearl), China. N Am J Fish Manage DOI: 10.1002/nafm.10420. [Google Scholar]
- Smogor RA, Angermeier PL, Gaylord CK. 1995. Distribution and abundance of American eels in Virginia stream: test of null model across spatial scales. Trans Am Fish Soc 124: 789–803. [Google Scholar]
- Sullivan MC, Able KW, Hare JA, Walsh HJ. 2006. Anguilla rostrata glass eel ingress into two, US east coast estuaries: patterns, processes and implications for adult abundance. J Fish Biol 69: 1081–1101. [Google Scholar]
- Tanaka H, Kagawa H, Ohta H, Unuma T, Nomura K. 2003. The first production of glass eel in captivity: fish reproductive physiology facilitates great progress in aquaculture. Fish Physiol Biochem 28: 493–497. [Google Scholar]
- Tanaka H. 2015. Progression in artificial seedling production of japanese eel anguilla japonica. Fish Sci 81: 11–19. [Google Scholar]
- Tatsukawa K. 2003. Eel resources in East Asia. Eel Biology. Springer. 293–298. [Google Scholar]
- Tsukamoto K. 2006. Spawning and migratory behavior of the Japanese eel. Nippon Suisan Gakk 72: 350–356. [Google Scholar]
- Tsukamoto K, Kuroki M, Watanabe S. 2020. Common names for all species and subspecies of the genus Anguilla. Environ Biol Fish 103: 985–991. [Google Scholar]
- Turner SM, Chase BC, Bednarski MS. 2018. Evaluating the effect of dam removals on yellow-phase American eel abundance in a Northeastern U.S. Watershed. N. Am J Fish Manag 38: 424–431. [Google Scholar]
- Tseng MC, Kao HW, Hung YH, Lee TH. 2012. A study of genetic variations, population size, and population dynamics of the catadromous Japanese eel Anguilla japonica (Pisces) in northern Taiwan. Hydrobiologia 683: 203–216. [Google Scholar]
- Wiley DJ, Morgan RP, Hilderbrand RH, Raesly RL, Shumway DL. 2004. Relations between physical habitat and American eel abundance in five river basins in Maryland. T Am Fish Soc 3: 515–526. [Google Scholar]
- Zhang H, He W, Tong CF, Lu JJ. 2008. The effect of fishing the anguillid elver (Anguilla japonica) on the fishery of the Yangtze estuary. Estuar Coast Shelf Sci 76: 902–908. [Google Scholar]
Cite this article as: Shuai F, Li X, Yang W, Chen W, Lek S. 2021. Habitat use of the Japanese eel (Anguilla japonica) and marbled eel (Anguilla marmorata) in the large subtropical Pearl River. Ann. Limnol. - Int. J. Lim. 57: 8
All Tables
Population structure of eels collected from sampling locations in the Pearl River.
All Figures
|
Fig. 1 Sampling sites. |
| In the text | |
|
Fig. 2 Length distribution of Japanese eels and marbled eels collected at sampling sites in the Pearl River between 2015 and 2018. |
| In the text | |
|
Fig. 3 Spatial patterns of Japanese eel (a) and marbled eel (b) populations in the Pearl River. The circle size represents the size of the eel population. Color contour represents the isoline of the spatial distribution of eel population. |
| In the text | |
|
Fig. 4 Ordination of population age structures of Japanese eels (a) and marbled eels (b) in a two-dimensional non-metric multidimensional scaling configuration. A dendrogram was used to illustrate the clustering of groups. Different symbols (and colors) denote respective groups. |
| In the text | |
|
Fig. 5 Variation in eel abundance and biomass for each group. Bars represent standard error, letters “a”, “b” and “c” represent difference. |
| In the text | |
|
Fig. 6 Redundancy analysis triplot showing relationships among eel assemblages and environmental variables (scaling 2). Green triangles represent different life stages of Japanese eels. Green circles represent different life stages of marbled eels. Environmental variables are represented by blue arrows. Solid lines depict significant environmental factors as opposed to dashed lines which are not significant. Red crosses represent number of eels collected at each sampling site. |
| In the text | |
Current usage metrics show cumulative count of Article Views (full-text article views including HTML views, PDF and ePub downloads, according to the available data) and Abstracts Views on Vision4Press platform.
Data correspond to usage on the plateform after 2015. The current usage metrics is available 48-96 hours after online publication and is updated daily on week days.
Initial download of the metrics may take a while.