Fig. 2
Download original image
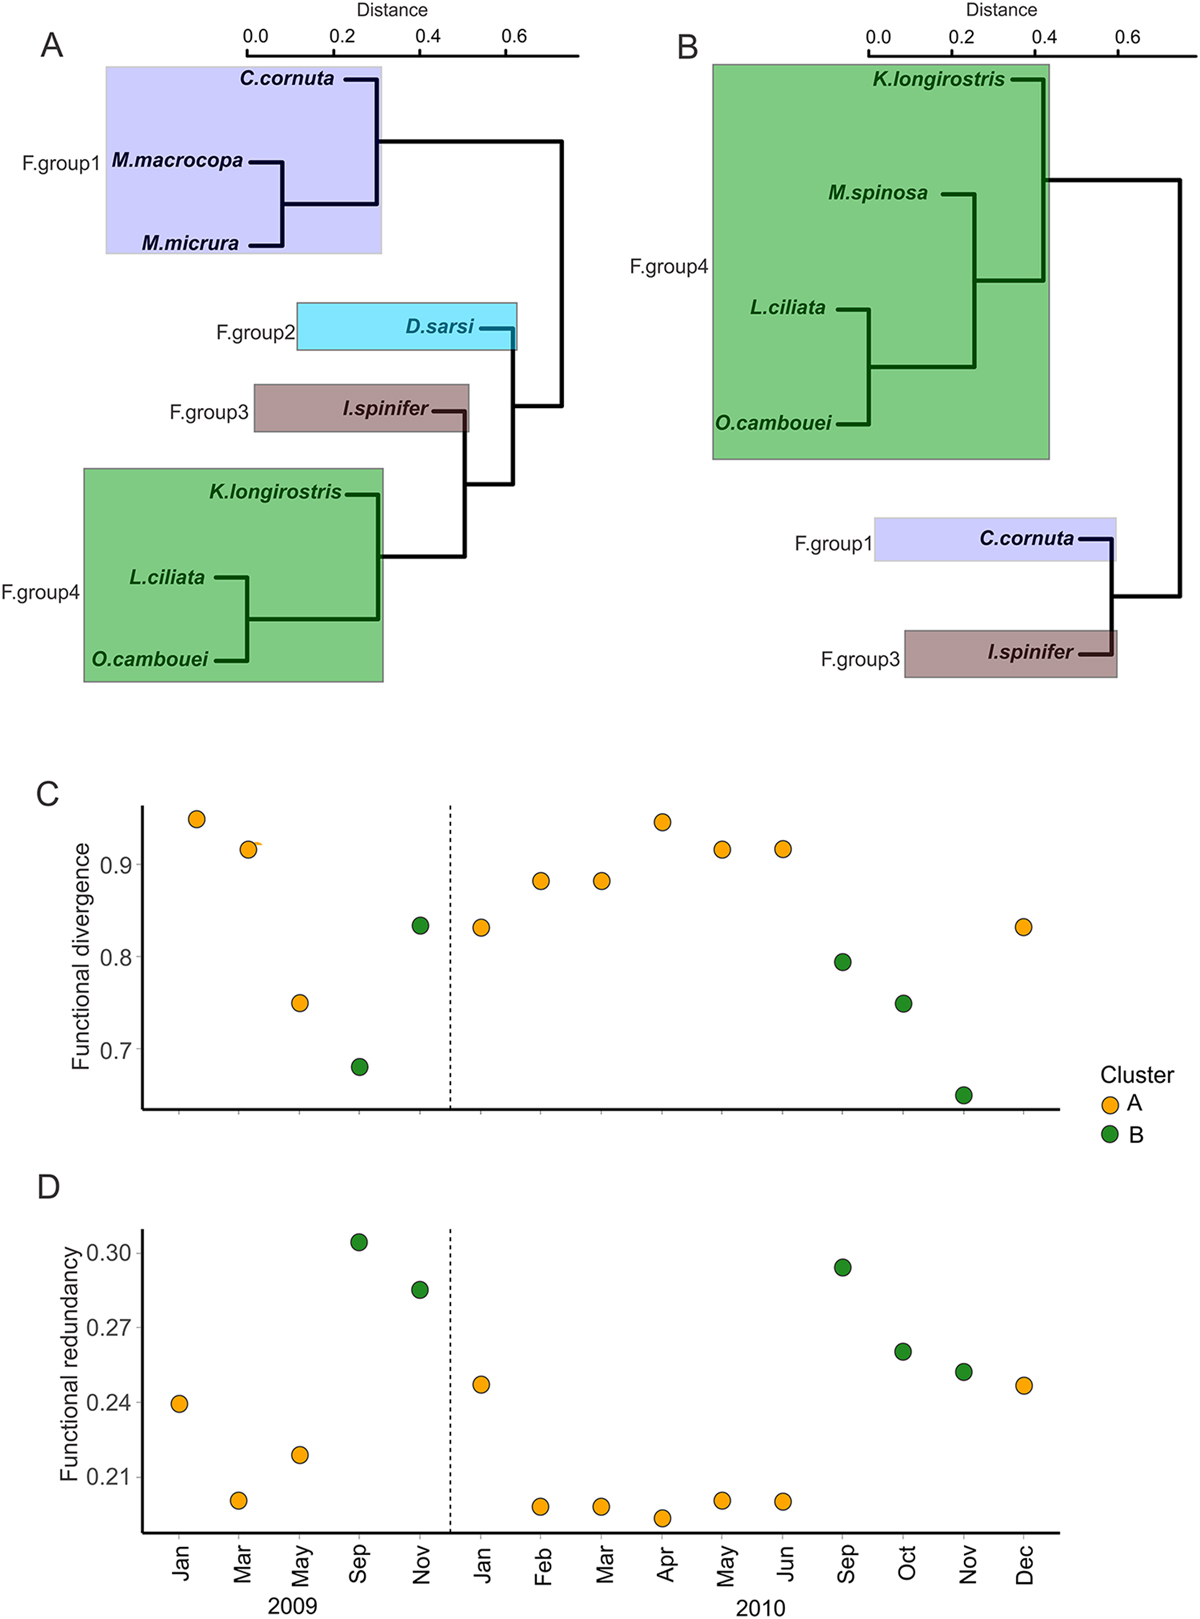
(A and B) Functional composition of cladocerans collected from the studied site for (A) Cluster A and B Cluster B, respectively (each colored box represents one functional group; the species shown in the clusters are based on total species found and hence do not reflect monthly changes). (C and D) Plots showing the (C) functional divergence and (D) functional redundancy across the sampling months of both years (two colors represent clusters A and B; dashed line separates the 2 years 2009 and 2010, respectively).
Current usage metrics show cumulative count of Article Views (full-text article views including HTML views, PDF and ePub downloads, according to the available data) and Abstracts Views on Vision4Press platform.
Data correspond to usage on the plateform after 2015. The current usage metrics is available 48-96 hours after online publication and is updated daily on week days.
Initial download of the metrics may take a while.