| Issue |
Int. J. Lim.
Volume 58, 2022
|
|
|---|---|---|
| Article Number | 12 | |
| Number of page(s) | 8 | |
| DOI | https://doi.org/10.1051/limn/2022012 | |
| Published online | 06 October 2022 | |
Research Article
Feeding ecology, trophic interaction and resource partitioning among four omnivorous finfish species of a tropical Estuary
Department of Industrial Fisheries, CUSAT, Kerala 682022, India
* Corresponding author: This email address is being protected from spambots. You need JavaScript enabled to view it.
Received:
11
April
2022
Accepted:
12
September
2022
Abstract
A crucial aspect of sustainable resource management is understanding the trophic interactions amongst fish in the estuarine ecosystem. The goal of this study was to look into the food preferences, feeding strategies, trophic partitioning, as well as dietary overlap among four omnivorous species that live in the Cochin Estuary: Mugil cephalus (n = 73), Planiliza parsia (n = 35), Planiliza planiceps (n = 65) and Chanos chanos (n = 55) through the analyses of gut-content. Index of relative importance demonstrated that prey items in Mugil cephalus and Planiliza planiceps guts were dominated by Bacillariophyceae whereas in Planiliza parsia and Chanos chanos guts were dominated by Myxophyceae. The highest diet value (7.5) was recorded in Chanos chanos, while the lowest was recorded in Mugil cephalus (5.69). The highest niche breadth value (0.77) was recorded in Planiliza planiceps while the lowest value was recorded in Planiliza parsia (0.52). Pianka's overlap, evaluated with the help of null models structured by Ecosim 7.0, showed remarkable niche overlap between Mugil cephalus and Planiliza planiceps (0–0.92, P < 0.001), between Planiliza planiceps and Planiliza parsia ( 0–0.77, P < 0.05) and between Mugil cephalus and Planiliza parsia ( 0–0.7, P < 0.05). The fish's trophic niche width, along with prey-specific abundance confirmed that they are generalist feeders. The present results differed from the general hypothesis related to the omnivorous species and concluded that these four omnivorous species live in the same niche zones of the Cochin Estuary with no interspecific conflict.
Key words: Cochin Estuary / feeding ecology / niche overlap / trophic interaction
© EDP Sciences, 2022
1 Introduction
Ecological studies are continuing to be interested in the strategies adopted by aquatic creatures to exploit resources. Dietary information on fish is crucial. For understanding fish behaviour, growth, reproduction, migration, and other crucial behaviours. It also predicts ecosystem changes due to natural or anthropogenic interventions (Priyadarshinis et al., 2012). In fish assemblages, food partitioning is more crucial than habitat partitioning (Schoener, 1974). Fish feeding ecology looks at how fish choose which food items to devour (Wotton, 1998). It examines various feeding adaptations following their morphological (Wotton, 1998), physiological as well as sensorineural reactions to different forms of food and their availability in their surroundings. Diel activity, niche overlap, as well as fish habitat selection, can all be influenced by food competition (Alanärä et al., 2001; David et al., 2007; Saeed et al., 2020).
In research on trophic interactions in fish populations, specifically in tropical habitats, variations in food composition amongst species as well as even across species between seasons have been discovered (Encina et al., 2004; Magalhaes, 1993; Paravicini et al., 2020). Certain habitats with similar food supplies attract many species that share these resources (Gabler and Amundsen, 2010; Sandlund et al., 2010). When food resources are shared, fish species cohabitation can be linked to the adoption of one or more characteristics, such as distinct activity patterns (Hesthagen et al., 2004) or divergent space usage (Amarasekare, 2003; Sandlund et al., 2010). Niche width is regarded as a critical parameter. It is used for assessing the degree of dietary specialisation for a particular set of species in a habitat (Segurado et al., 2011). More specialised species have narrower niche breadths. Generalist species have larger niches. Niche overlap analysis is a useful tool for evaluating community structure concerning different species' feeding niches (Corrêa et al., 2011). Specialists and generalists, for example, might be utilized to categorise a group of species in a habitat according to their specialisation in utilizing certain resources (Costello, 1990). On the other hand, sample size, frequency, sampling duration, as well as the number of resources evaluated can all have a big impact on feeding classifications (Ricklefs and Lau, 1980; Smith and Zaret, 1982). But they are extremely useful in describing fish feeding behaviour on a larger scale (Ferry and Cailliet, 1996). Across the globe, invading generalists with broad ecological niches are replacing specialised taxa, a tendency known as biotic homogenisation (McKinney and Lockwood, 1999; Clavel et al., 2011). Many generalist species have a competitive advantage in that they can live in damaged habitats (McKinney and Lockwood, 1999; Layman and Allgeier, 2012). Natural fish feeding studies allow researchers to determine the trophic linkages that exist in aquatic habitats, as well as the feeding composition and structure of food webs (Zavala, 1996; Hahn et al., 1997; Dinh et al., 2020). Diet composition research is crucial in community ecology as animals' resource usage has a significant impact on population dynamics within a group?(Mequilla and Campos, 2007; Moon et al., 2020). Data on the various foods consumed by fish could potentially lead to the discovery of a stable food choice and the development of trophic models. (Bachok et al., 2004; Lopez and Arcila, 2002; Kim et al., 2021).
Estuaries are highly productive habitats that serve as vital refuges and feeding grounds for many species' young (Boehlert and Mundy, 1988; Potter et al., 1997; Van Niekerk and Turpie, 2012; Vasconcelos et al., 2015). Many estuarine-dependent species' adults are economically fished, adding to fisheries production (Pollard, 1981). Tropical estuaries are highly dynamic ecosystems that experience significant seasonal variations in combined hydrological as well as faunal conditions features (Blaber, 2002; Albaret et al., 2004; Fath et al., 2019). The length-weight relationship of these fishes inhabiting Vembanad lake, part of Cochin Estuary, southern India, has been reported (Nandan and Renjini 2011). But no studies have so far been attempted on their feeding habits, trophic ecology and trophic interactions.
The goal of this study was to look into the food preferences, feeding strategies, trophic partitioning, as well as dietary overlap among four omnivorous species that live in the Cochin Estuary: Mugil cephalus (Linnaeus 1758), Planiliza parsia (Hamilton 1822), Planiliza planiceps (Valenciennes 1836) and Chanos chanos (Forsskal 1775). The hypothesis has also been tested that these omnivores are generalist feeders and that the coexistence of such sympatric species leads to resource conflict.
2 Materials and methods
2.1 Study Area
On India's west coast, the Cochin Estuary (9°40' −10 °12' N and 76°10'–76°30' E) is the country's biggest estuarine system. The Cochin Estuary, which is part of the Vembanad–Kol wetland system, is approximately 450 m–4 km broad and 3–15 m deep (Shivaprasad et al., 2013). With typical daily temperatures ranging from 19.8 °C to 36.7 °C, the estuary has a humid equatorial tropical climate. In the coastal waters, the average yearly temperature ranges from 25.0 °C to 27.5 °C (Shivaprasad et al., 2013). Pre-monsoon (March to May) often receives the lowest rainfall on record, with a combined average of just 386 mm month−1, indicating the peak of the “ry” season. Conversely, the southwest monsoon (June to September) experiences the most rainfall, with average and maximum totals of 1400 mm and 1891 mm month−1, respectively, defining the peak of the “wet” season (Shivaprasad et al., 2013). The Central Water Commission provided the information on freshwater runoff for the years 2018 to 2019. The overall discharge was between 60% and 70% between June and September and 6.82% between December and February. Salinity readings in the surface and bottom waters varied greatly, ranging from 0.01 ppt to 34 ppt. Because of sea water ingress from the Arabian Sea, the bottom water has a higher salinity than the surface water (Joseph et al., 2010). The harvest of the estuary fisheries has been stated to decrease (Asha et al., 2016). In cumulative landings which have a link to the lack of several big marine migrants, a decline has been observed by finfish species diversity from 125 to 80, which also includes the examined fish species, the economically important one (Maitra et al., 2018).
2.2 Dietary analyses
A total of 228 individuals containing Mugil cephalus (n = 73), Planiliza parsia (n = 35), Planiliza planiceps (n = 65) and Chanos chanos (n = 55) were drawn from estuarine fishery-dependent catches in five sampling sites between April 2019–March 2020 ( Fig. 1). The fish were dissected for stomach content analysis after total length (LT) as well as standard length (LS) were measured to the nearest mm and body mass (M) was measured to the nearest g. Prey items were collected and classified to the minimum taxonomic level possible from dissected stomachs. The frequency of occurrence (O%), percent quantity (N%), and percent volume (V%) of prey items were computed using Hyslop's formula (1980). The diet composition was found out by index of relative importance (IRI%) following Pianka (1971): IRI% = 100((N% + V%)O%−1)(Σ(N% + V%)O%−1)−1.
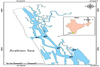 |
Fig. 1 Location of examined species sampling sites (S) in Cochin estuary. |
2.3 Trophic niche and diet breadth
The diet breadth (B) was computed using Levin's index (1968): B = (Σni=1 P 2 i)−1, where, P 2 i is the proportion of food item i and ni is the total number of food items in the diet. Using individual prey number data, Levin's measure (Krebs, 1999) was used to assess each species' niche breadth. Hurlbert's formula (1978) was used to standardise the trophic niche measure (ranging from 0 to 1): BA = (n–1)–1((Σni = 1 P 2 i) − 1–1), where p2i is the proportion of a food category in a species' diet and n is the total number of food categories. Low (0–0.39), middle (0.4–0.6), or high (0.61–1; adapted from Grossman, 1986) trophic niche breadth was used. Trophlab software was used to calculate each species' trophic level based on the diet composition, as recommended by Pauly et al. (2000) and Mann–Whitney tests were performed to find if any significant difference exist between the trophic level values.
2.4 Null models and Niche overlap
Pianka's index (1971) was used to calculate species feeding overlap, which ranged from 0 to 1, with 1 indicating complete overlap. Ecosim 7.0 was used to calculate pair-wise niche overlap estimates (Gotelli and Entsminger, 2007). Using Ecosim 7.0, the niche overlap pattern was generated as well as quantitatively tested against null models (Gotelli and Entsminger, 2007). By conducting 1000 Monte Carlo randomizations and mathematically contrasting the patterns in these simulated communities with those in the real data matrix, the computer developed pseudo-communities (mean niche overlap values for all species pairs). Following Corrêa et al. (2011), a probability (P) value of 0.05 for observing a value >1.0 by chance was judged significant.
2.5 Feeding strategies as well as prey-specific abundance
Prey-specific abundance (APS) was calculated as follows: SSTi is the total stomach content, especially in predators with prey i in their stomach, and APSi is the prey-specific abundance of prey i, according to Amundsen et al. (1996). On a two-dimensional graph, prey-specific abundance (APSi) was plotted against the frequency of occurrence (O%) for each species. Diagonals and axes of the figure can be used to derive the relevance of prey, feeding strategy, and phenotypic contribution to niche width (Amundsen et al., 1996). Diagonal from the lower left to the higher right corner represented the significance of prey to the whole population, with dominating prey at the top right-hand corner and uncommon and insignificant prey at the bottom end. The vertical axis depicted the feeding strategy in terms of specialisation versus generalisation: experts had all prey spots in the top half of the graph, while generalists had all prey points in the lower half. The points in the upper left represented specialized subgroups of the predator population, while the points in the upper right suggested specialisation by the entire predator population on a specific prey (Amundsen, 1995; Amundsen et al., 1996).
3 Results
3.1 Diet composition along with index of relative importance
Table 1 lists the specifics of morphometric measures taken on fish whose stomach contents were being examined. The P. parsia species had the smallest mean length (10.71 ± 1.27 cm), whereas C. chanos had the longest mean length (30.18 ± 4.21 cm) (Tab. 1). Statistical analyses were performed on the LT values obtained during the current investigation and their equivalent values in Fishbase, but no significant differences were found (Mann–Whitney tests).The gut contents of fish were analysed to identify 13 different species of prey. Algae were the most prevalent prey item seen across all four species, according to the IRI% of prey items ( Tab. 2). Microplastics were also discovered in the intestinal contents of M. cephalus and C. chanos. Perceptibly higher importance of detritus (20.29% and 20.1%) was noticeable in P. planiceps and C. chanos. Shrimp larvae were discovered in all four species. Fish body parts were discovered in the diets of P. parsia, but they were not favoured. Incidence of Ostracod was only discovered in C. chanos. M. cephalus showed a stronger preference for eating insects compared to the other species. P. parsia preferred myxophyceae while P. planiceps had relatively more inclination to bacillariophyceae.
Details of mean total length (LT) and range, and mean total mass (M) of examined fishes sampled from the Cochin Estuary.
Estimates of index of relative importance (IRI%) in examined species inhabiting Cochin Estuary.
3.2 Dietary as well as trophic niche breadth along with the trophic level value
All four species had high values for both diet and niche breadth. C. chanos (B = 7.5) and M. cephalus (B = 5.69, Tab. 3) had the greatest as well as lowest diet breadth values, respectively. The greatest, as well as minimum niche breadth values, were obtained in P. planiceps (BA = 0.77) and P. parsia (BA = 0.52) respectively (Tab. 3). The four species' trophic levels were computed from their food compositions and found to be 2.5, 2.7, 2.4, and 2.6 in M. cephalus, P. parsia, P. planiceps, and C. chanos, respectively, indicating that they were omnivores with a preference for vegetable material as they eat mainly algae.
Levin's index of diet breadth (Ba), Levin's standardised niche breadth (BA) and trophic level estimated for four examined species inhabiting Cochin Estuary [a reference scale for niche breadth: 0–0.39 low, 0.4–0.6 intermediate, 0.61–1.0 high (modified from Grossman, 1986).]
3.3 Null model simulation and Niche overlap
During Pianka's diet overlap investigation, six different species combinations were provided and examined (Tab. 4). M. cephalus and P. planiceps (0.92), C. chanos and P. parsia (0.91), and C. chanos and P. planiceps (0.91) had very high overlap values, whereas M. cephalus −P. parsia (0.7), M. cephalus −C. chanos (0.78), and P. parsia-P. planiceps (0.77) had statistically significant overlap values (P < 0.05).
With both reshuffled zeroes and kept zeroes choices, the null communities generated using a Monte Carlo simulation model revealed significantly (P < 0.05) higher observed values than expected by chance across all four omnivorous species. Remarkably low p-values indicated that four species living in the Cochin Estuary may share resources.
Pianka's index niche overlap value (INO) a and Monte-Carlo simulation P-value for four examined species inhabiting Cochin Estuary [a INO > 0.60, biologically significant].
3.4 Phenotypic contributions, prey-specific abundance and feeding strategy
In terms of contribution to both O% and ASP %, the prey items showed a fairly similar trend. Three fishes preferred bacillariophyceae but P. parsia preferred myxophyceae ( Fig. 2). All of the prey items reported APSi 40% or below in these four species, indicating a definite generalist eating pattern. Nevertheless, the majority of the prey items had low prey specific abundances O%, even though the O% was significantly larger. This demonstrates that prey items have a lesser preference within the population as compared to their presence in the environment. The majority of prey items are found in the graph's lower left corner, implying that, despite the presence of food items in the surroundings, the fish population avoided them. This finding further supports the omnivores' strong reliance and predilection for estuary algae and debris.
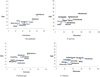 |
Fig. 2 Predator feeding strategy diagram of examined species from the Cochin Estuary (following Amundsen et al., 1996). |
4 Discussion
Diet abundance, composition, and niche overlaps are investigated in four species from the Cochin Estuary, along with trophic ecology, feeding behaviours, food preferences as well as a dietary crossover. The influence of ontogeny, as well as a size-based variation on niche partitioning of M. cephalus in the United States, was explored by Eggold and Motta (1992), who discovered considerable resource partitioning only during the main ontogenetic phase. In the current experiment, however, the IRI % values obtained in size groups revealed no significant variation.
All four species tested in this study had trophic levels ranging from 2.0 to 3.0, designating them as herbi-Omni-detrivores, with P.parsia having the highest LT value (2.7 ± 0.5). However, Fishbase (Froese and Pauly, 2019), which keeps track of trophic levels for a variety of fish species, shows a value of 2.0 ± 0.0, indicating that P. parsia is a herbivore. Similarly, the present study's LT value for P. planiceps was 2.4 ± 0.3, compared to 2.0 ± 0.0 in Fishbase, while the current study's LT value for C.chanos was 2.6 ± 0.35, compared to 2.4 ± 0.2 in Fishbase.
In different environments, a species' trophic level varies based on the food items accessible, feeding habits, diet breadth, but also the trophic level of its closest relative. (Pauly and Christensen 2000). This explains P. parsia's increased trophic value, which may be attributed to the presence of fish larvae, shrimp larvae, and insects in its diet.
Hurlbert (1978) proposed that niche breadth value is a measure of trophic specialisation, Amundsen et al. (1996) proposed that niche breadth index paired with feeding strategy provides a better knowledge of trophic niche width. When the numbers are compared to graphs of APS plotted versus O%, analyzing the niche width becomes easy. Because of the presence of dominating prey items on the bottom left and lower right corners of the APS graphs, all four species were characterised as generalist feeders in this research. As stated by Amundsen et al. (1996), a generalist predator's nutritional niche is relatively broad, whereas a specialist's food niche is quite limited. A population with a limited niche width must also be made up of individuals who have restricted and specialised niches. True herbivores, as well as carnivores, would be classified as specialised feeders as a result of this classification.
M. cephalus feeding habit consists of the broad spectrum of prey items which eventually leads to their feeding as generalized ones (Rao and Babu, 2013; Bekova et al., 2013). In addition, the APS–O% graphs (Fig. 2) in all four species revealed quite a major prey item in the bottom left corner. The most common prey items in all four species was algae. Dinoflagellates, copepod, foraminifera, insects, shrimp larvae, and fish larvae were discovered to be avoided food items within the four species' phenotypes. This demonstrates the fishes' generalised reliance on various prey. Based on the feeding approach exhibited in this study, we can affirm that these fishes are benthic feeders and are highly reliant on the benthic food chain.
Generalist feeders, also known as opportunistic feeders generally have a bigger number of prey items in their stomachs (Amundsen et al., 1996; Hossain et al., 2017). Specialist feeders rely on a smaller number of prey that does not belong to different ecological niches. As previously stated, all four fishes demonstrated generalist feeding behaviours with moderate reliance on more similar prey items in the current investigation.
El-marakby et al. (2006) discovered that striped mullet do not consume food at random, but rather choose what they eat. Muchlisin et al. (2015) reported that two omnivorous endemic species of Lake Laut taware show specialized diet preference and select Closteriopsis sp and Arcella sp. The omnivore species of the Cochin Estuary, despite evidence of specialist behaviour in other omnivores, displayed generalist feeding methods and a wider niche breadth, similar to genuine omnivores.
Pianka's pair-wise niche overlap values were much higher than those of the other species. Examined species that have significant nutritional overlap might explain their comparable prey preferences. Variability as well as the availability of prey items have been found to influence ecological competition between conspecifics and interspecific (Ward et al., 2006).
Despite the relatively high niche overlap values, the null model simulation programme found evidence of extensive resource sharing in the fish assemblage's eating behaviours. The niche overlap values revealed were all much higher than anticipated by chance.
Rivals can live under situations of considerable overlap, according to Ågren and Fagerström (1984) and Keddy (1989), if they are equivalent competitors and use niches in comparable ways. The fact that P. parsia, P. planiceps, Chanos chanos, and M. cephalus all eat the same foods, results in an overlap of prey items. Because of the low and fluctuating number of invertebrate prey species, food rivalry and dietary overlap between fish species are common in estuarine systems (Moyle and Cech, 2004). However, because of the high abundance of the major prey, resource competition is generally minimal when prey overlap between two species is substantial (Klemetsen, 1993). This rationale might be deemed more pleasant, as it emphasises the richness of benthic resources (detritus, benthic crustacean) in the Cochin Estuary.
Blaber (1976) wanted to see if there was any interspecific rivalry among the mugilid species in Lake St Lucia, including M. cephalus. He discovered that there was a lot of dietary overlap but minimal geographical segregation, indicating that all these species are using a non-limiting and plentiful resource. Following an assessment of the feeding behaviours of M. cephalus and Liza macrolepis, Luther (1962) arrived at the same result (now Chelon macrolepis). M. cephalus exhibited the same eating habits as the other three species and filled the same niche, according to this study.
Environmental variableness, as well as seasonal succession, synchronize the diversity along with the abundance of prey organisms including plankton, benthos, and other invertebrates in estuaries (Jendyk et al., 2014; Leterme et al., 2015), which may contribute to the value of overlap, resource sharing, or potential resource competition between species (Jendyk et al., 2014; Leterme et al., 2015). The current study shows that niche or diet overlap by itself does not give omnivores a comprehensive picture of resource utilisation and potential resource rivalry. Large overlap levels, according to Gotelli and Graves (1996), indicate common resource utilisation and a lack of rivalry. The strong competition which has not yet culminated in resource segregation, on the other hand, might suggest high overlap. In terms of getting a satisfying result, the null model approach is quite obedient. However, according to Corrêa et al. (2011), null models can only suggest in which direction observed trends are going, and further data on accessibility and species interactions might offer more precise responses in the name of niche overlap together with resource status. More information on seasonal fluctuations in intestinal prey abundance and the associated diet overlap (or lack thereof) might be useful in understanding seasonal resource consumption patterns, for example. Due to the region's probable richness of benthic prey resources, the current study reveals that these four omnivorous species only with the widest feeding strategies and greatest dietary overlap live in the same niche zones of the Cochin Estuary with no interspecific conflict.
Funding
The authors declare that no funds, grants, or other support were received during the preparation of this manuscript.
Competing interests
The authors have no relevant financial or non-financial interests to disclose.
Author contributions
SDD conceived, designed the experiments, performed the experiments, analyzed and wrote the manuscript.
Availability of supporting data
The corresponding author will share the datasets produced and/or analysed during the current work upon reasonable request.
Ethical approval
All applicable international, national, and/or institutional guidelines for sampling, care, and experimental use of organisms for the study have been followed.
Acknowledgements
The author would like to express his gratitude to the Director of the Cochin University of Science and Technology's School of Industrial Fisheries for providing the required facilities for conducting research at the school.
References
- Ågren GI, Fagerström T. 1984. Limiting dissimilarity in plants: Randomness prevents exclusion of species with similar competitive abilities. Oikos 43: 369–375. [CrossRef] [Google Scholar]
- Alanärä A, Burns MD, Metcalfe NB. 2001. Intraspecific resource partitioning in brown trout: The temporal distribution of foraging is determined by social rank. J Animal Ecol 70: 980–986. [Google Scholar]
- Albaret JJ, Simier M, Darboe FS, Ecoutin JM, Raffray J, de Morais LT. 2004. Fish diversity and distribution in the Gambia Estuary, West Africa, in relation to environmental variables. Aquat Liv Resour 17: 35–46. [CrossRef] [EDP Sciences] [Google Scholar]
- Amarasekare P. 2003. Competitive coexistence in spatially structured environments: a synthesis. Ecol Lett 6: 1109–1122. [CrossRef] [Google Scholar]
- Amundsen PA. 1995. Feeding strategy of Arctic charr (Salvelinus alpinus): general opportunist, but individual specialist. Nordic J Freshw Res 71: 150–156. [Google Scholar]
- Amundsen PA, Gabler HM, Staldvik FJ. 1996. A new approach to graphical analysis of feeding strategy from stomach contents data— modification of the Costello (1990) method. J Fish Biol 48: 607–614. [Google Scholar]
- Asha CV, Retina CI, Suson PS, Bijoy Nandan S. 2016. Ecosystem analysis of the degrading Vembanad wetland ecosystem, the largest Ramsar site on the South West Coast of India – measures for its sustainable management. Regl Stud Mar Sci 8: 408–421. [Google Scholar]
- Bachok Z, Mansor MI, Noordin RM. 2004. Diet composition and food habits of demersal and macrobenthos in relation to some physical and pelagic marine fishes from Terengganu waters, east coast of Peninsular, Malaysia. Naga 27: 41–47. [Google Scholar]
- Bekova R, Raikova-Petrova G, Gerdzhikov D, Petrova E, Vachkova V. 2013. Food spectrum of grey mullet (L) along the Bulgarian Black Sea coast. Agric Sci Technol 2: 173–178. [Google Scholar]
- Blaber SJM. 1976. The food and feeding ecology of Mugilidae in the St. Lucia lake system. Biol J Linn Soc 8: 267–277. [CrossRef] [Google Scholar]
- Blaber SJM. 2002. “Fish in hot water”: the challenges facing fish and fisheries research in tropical estuaries. J Fish Biol 61: 1–20. [Google Scholar]
- Boehlert GW, Mundy BC. 1988. Roles of behavioural and physical factors in larval and juvenile fish recruitment to estuarine nursery areas. Am Fish Soc Symp 3: 1–67. [Google Scholar]
- Clavel J, Julliard R, Devictor V. 2011. Worldwide decline of specialist species: toward a global functional homogenization? Front Ecol Environ 9: 222–228. [CrossRef] [Google Scholar]
- Corrêa CE, Albrecht MP, Hahn NS. 2011. Patterns of niche breadth and feeding overlap of the fish fauna in the seasonal Brazilian Pantanal, Cuiabá River basin. Neotrop Ichthyol 9: 637–646. [CrossRef] [Google Scholar]
- Costello MJ. 1990. Predator feeding strategy and prey importance: a new graphical analysis. J Fish Biol 36: 261–263. [Google Scholar]
- David BO, Closs GP, Crow SK, Hansen EA. 2007. Is diel activity determined by social rank in a drift-feeding stream fish dominance hierarchy? Anim Behav 74: 259–263. [CrossRef] [Google Scholar]
- Dinh QM, Tran LT, Tran TMT, To DK, Nguyen TTK, Tran DD. 2020. Variation in diet composition of the mudskipper Periophthalmodon septemradiatus from Hau River, Vietnam. Bull Mar Sci 96: 487–500. [CrossRef] [Google Scholar]
- Eggold BT, Motta P. 1992. Ontogenetic dietary shifts and morphological correlates in striped mullet, Mugil cephalus . Environ Biol Fishes 34: 139–158. [CrossRef] [Google Scholar]
- El-Marakby HI, Eid AM, Abdelghany AE, Abdel-Tawwab M. 2006. The Impact of Striped Mullet, Mugil cephalus on Natural Food and Phytoplankton Selectivity at Different Feeding Regimes in Earthen Fishponds. J Fisheries Aquatic Science 1: 87–96. [Google Scholar]
- Encina L, Rodríguez-Ruiz A, Granado-Lorencio C. 2004. Trophic habits of the fish assemblage in an artificial freshwater ecosystem: The Joaquin Costa reservoir, Spain. Folia Zoolog 53: 437–449. [Google Scholar]
- Fath BD, Asmus H, Asmus R, et al. 2019. Ecological network analysis metrics: the need for an entire ecosystem approach in management and policy. Ocean Coastal Manag 174: 1–14. [CrossRef] [Google Scholar]
- Ferry LA, Cailliet GM. 1996. Sample size sufficiency and data analysis: Are we characterizing and comparing diet properly? In Feeding ecology and nutrition in fish: Proceedings of the symposium on the feeding ecology and nutrition in fish , edited by D. Mackinlay, K. Shearer. San Francisco, CA: International Congress on the Biology of Fishes, American Fisheries Society, pp. 71–80. [Google Scholar]
- Froese R, Pauly D (Eds.). 2019. Fishbase. Version (02/2019) . World Wide Web electronic publication. Retrieved from www.Fishbase.org [Google Scholar]
- Gabler H M, Amundsen PA. 2010. Feeding strategies, resource utilisation and potential mechanisms for competitive coexistence of Atlantic salmon and alpine bullhead in a sub-Arctic river. Aquatic Ecology 44: 325–336. [CrossRef] [Google Scholar]
- Gotelli NJ, Entsminger GL. 2007. EcoSim: Null models software for ecology, version 7 . Jericho, VT: Acquired Intelligence Inc. & Kesey-Bear. [Google Scholar]
- Gotelli NJ, Graves GR. 1996. Null models in ecology . Washington, DC: Smithsonian Institution Press. [Google Scholar]
- Grossman GD. 1986. Food resource partitioning in a rocky intertidal fish assemblage. J Zool 1: 317–355. [CrossRef] [Google Scholar]
- Hahn NS, Fugi R, Almeida VLL, Russo MR, Loureiro VE. 1997. Dieta e atividade alimentar de peixes do reservatório de Segredo. In Reservatório de Segredo - bases ecológicas para o manejo , edited by A.A. Agostinho and L.C. Gomes. Maringá: Eduem/Nupelia. 387 p. [Google Scholar]
- Hesthagen T, Saksgård R, Hegge O, Dervo BK, Skurdal J. 2004. Niche overlap between young brown trout (Salmo trutta) and Siberiansculpin (Cottus poecilopus) in a subalpine Norwegian river, in The Atna River: Studies in an Alpine— Boreal Watershed , edited by O.T. Sandlund, K. Aagaard. Dordrecht, The Netherlands: Springer, pp. 117–125. [CrossRef] [Google Scholar]
- Hossain MA, Hemraj DA, Ye Q, Leterme SC, Qin JG. 2017. Diet overlap and resource partitioning among three forage fish species in Coorong, the largest inverse estuary in Australia. Environ Biol Fishes 100: 639–654. [CrossRef] [Google Scholar]
- Hurlbert SH. 1978. The measurement of niche overlap and some relatives. Ecology 59: 67–77. [CrossRef] [Google Scholar]
- Jendyk J, Hemraj DA, Brown MH, Ellis AV, Leterme SC. 2014. Environmental variability and phytoplankton dynamics in a South Australian inverse estuary. Contin Shelf Res 91: 134–144. [CrossRef] [Google Scholar]
- Joseph S, Ouseph PP. 2010. Assessment of nutrients using multivariate statistical techniques in estuarine systems and its management implications: a case study from Cochin Estuary, India. Water Environ J 24: 126–132. [Google Scholar]
- Keddy PA. 1989. Effects of competition from shrubs on herbaceous wetland plants: a 4-year field experiment. Can J Bot 67: 708–716. [CrossRef] [Google Scholar]
- Kim JY, Atique U, An KG. 2021. Relative abundance and invasion dynamics of alien fish species linked to chemical conditions, ecosystem health, native fish assemblage, and stream order. Water 13: 158. [CrossRef] [Google Scholar]
- Krebs CJ. 1999. Ecological methodology . Addison Wesley Longman, INC: Menlo Park, CA. [Google Scholar]
- Layman CA, Allgeier JE. 2012. Characterizing trophic ecology of generalist consumers: A case study of the invasive lionfish in The Bahamas. Mar Ecol Progr Ser 448: 131–141 [CrossRef] [Google Scholar]
- Leterme SC, Allais L, Jendyk J, et al. 2015. Drought conditions and recovery in the Coorong wetland, South Australia in 1997–2013. Estuar Coast Shelf Sci 163: 175–184. [CrossRef] [Google Scholar]
- Levins R. 1968. Evolution in changing environments: Some theoretical explorations (No. 2) . Princeton, NJ: Princeton University Press. [CrossRef] [Google Scholar]
- Lopez peralta RH, Arcila CAT. 2002. Diet and composition of fish species from the southern continental shelf of Colombia. Naga 25: 23–29. [Google Scholar]
- Luther G. 1962. The food habits of Liza macrolepis (Smith) and M cephalus L. (Mugilidae). Indian J. Fish. 9: 604–626. [Google Scholar]
- Magalhaes MF. 1993. Feeding of an Iberian stream cyprinid assemblage: Seasonality of resource use in a highly variable environment. Oecologia 96: 253–260. [CrossRef] [PubMed] [Google Scholar]
- Maitra S, Harikrishnan M, Shibu AV, Sureshkumar S, Ranjeet K, Nandan SB. 2018. Studies on temporal variations of exploited fishery resources and their trophic levels in a tropical estuary. Regl Stud Mar Sci 22: 61–69. [Google Scholar]
- McKinney ML, Lockwood JL. 1999. Biotic homogenization: a few winners replacing many losers in the next mass extinction. Trends Ecol Evolut 14: 450–453. [CrossRef] [Google Scholar]
- Mequilla AT, Campos WL. 2007. Feeding relationships of dominant fish species in the Visayan Sea. Science Diliman 19: 35–46. [Google Scholar]
- Moon WK, Atique U, An KG. 2020. Ecological risk assessments and eco-toxicity analyses using chemical, biological, physiological responses, DNA damages and gene-level biomarkers in Zebrafish (Danio rerio) in an urban stream. Chemosphere 239: 124754. [CrossRef] [PubMed] [Google Scholar]
- Moyle PB, Cech J. 2004. An introduction to ichthyology . Upper Saddle River, NJ: Pearson Prentice Hall. [Google Scholar]
- Muchlisin ZA, Rinaldi F, Fadli N, Adlim M, Siti-Azizah MN. 2015. Food preference and diet overlap of two endemic and threatened freshwater fishes, depik (Rasbora tawarensis) and kawan (Poropuntius tawarensis) in Lake Laut Tawar, Indonesia. AACL Bioflux 8: 40–49. [Google Scholar]
- Nandan B, Renjini PK. 2011. Length-weight relationship, condition factor & morphometry of gold spot mullet Liza parsia from Cochin estuary. Indian J Geo Mar Sci 40: 567–571. [Google Scholar]
- Paravicini V, Casey J, Schiettekatte M, et al. 2020. Delineating reef fish trophic guilds with global gut content data synthesis and phylogeny. PLOS Biol 18: e3000702. [CrossRef] [PubMed] [Google Scholar]
- Pauly D, Christensen V. 2000. Trophic levels of fishes, in Fishbase 2000: Concepts, design and data sources , edited by R. Froese, D. Pauly. Los Banos, Philippines: ICLARM. 181 p. [Google Scholar]
- Pauly D, Froese R, Saa PS, Palomares ML, Christensen V, Rius J. 2000. TrophLab manual . Manila, Philippines: ICLARM. [Google Scholar]
- Pianka ER. 1971. Ecology of the agamid lizard Amphibolurus isolepis in Western Australia. Copeia 1971: 527–536. [CrossRef] [Google Scholar]
- Pollard DA. 1981. Estuaries are valuable contributors to fisheries production. Aust Fish. 40: 7–9. [Google Scholar]
- Potter, IC, Claridge PN, Hyndes GA, Clarke, KR. 1997. Seasonal, annual and regional variations in ichthyofaunal composition in the inner Severn Estuary and inner Bristol Channel. J Marine Biological Association United Kingdom 77: 507–525. [CrossRef] [Google Scholar]
- Priyadarshini S, Manoharan J, Varadharjan D, Subramaniyan A. 2012. Interpretation of the food and feeding habits of Dascyllus trimaculatus (Ruppell, 1829) from Gulf of Mannar, South East coast of India. Arch Appl Sci Res 4: 1758–1762. [Google Scholar]
- Rao RK, Babu KR. 2013. Studies on food and feeding habits of Mugil cephalus (Linnaeus 1758) east coast of Andhra Pradesh India. Can J Basic Appl Sci 3: 2499–2504. [Google Scholar]
- Ricklefs RE, Lau M. 1980. Bias and dispersion of overlap indices:?Results of some Monte Carlo simulations. Ecology 61: 1019–1024. [CrossRef] [Google Scholar]
- Saeed F, Iqbal KJ, Atique U, et al. 2020. Toxic trace metals assessment in selected organs of edible fish species, sediment and water in Head Punjab, Punjab, Pakistan. Punjab Univ. J Zool 35: 43–50. [Google Scholar]
- Sandlund OT Museth J, Naesje TF, Rognerud S, Saksgård R, Hesthagen T, Borgstrøm R. 2010. Habitat use and diet of sympatric Arctic charr (Salvelinus alpinus) and whitefish (Coregonus lavaretus) in five lakes in southern Norway: Not only interspecific population dominance? Hydrobiologia 650: 27–41. [CrossRef] [Google Scholar]
- Schoener TW. 1974. Resource partitioning in ecological communities. Science 185: 27–39. [Google Scholar]
- Segurado P, Santos JM, Pont D, et al. 2011. Estimating species tolerance to human perturbation: expert judgment versus empirical approaches. Ecol Indic 11: 1623–1635. [CrossRef] [Google Scholar]
- Shivaprasad A, Vinita J, Revichandran C, Manoj NT, Jayalakshmy KV, Muraleedharan KR. 2013. Ambiguities in the classification of Cochin Estuary, West coast of India. Hydrol Earth Syst Sci Discuss 10: 3595–3628. [Google Scholar]
- Smith EP, Zaret TM. 1982. Bias in estimating niche overlap. Ecology 63: 1248–1253. [CrossRef] [Google Scholar]
- Van Niekerk L, Turpie JK. 2012. National Biodiversity Assessment 2011: Technical Report. Volume 3: Estuary Component. CSIR Report Number CSIR/NRE/ECOS/ER/2011/0045/B. Council for Scientific and Industrial Research, Stellenbosch. [Google Scholar]
- Vasconcelos RP, Henriques S, França S, Pasquaud S, Cardoso I, Laborde M, Cabral HN. 2015. Global patterns and predictors of fish species richness in estuaries. J Anim Ecol 84: 1331–1341. [CrossRef] [PubMed] [Google Scholar]
- Ward AJ, Webster MM, Hart PJ. 2006. Intraspecific food competition in fishes. Fish Fish 7: 231–261. [CrossRef] [Google Scholar]
- Wotton RJ. 1998. Ecology of teleost fishes . Dordrecht, The Netherlands: Kluwer Academic Publisher. [Google Scholar]
- Introdução aos estudos sobre alimentação natural em peixes. Maringá: EDUEM. [Google Scholar]
Cite this article as: Dutta S. 2022. Feeding ecology, trophic interaction and resource partitioning among four omnivorous finfish species of a tropical Estuary. Int. J. Lim. 58: 12:
All Tables
Details of mean total length (LT) and range, and mean total mass (M) of examined fishes sampled from the Cochin Estuary.
Estimates of index of relative importance (IRI%) in examined species inhabiting Cochin Estuary.
Levin's index of diet breadth (Ba), Levin's standardised niche breadth (BA) and trophic level estimated for four examined species inhabiting Cochin Estuary [a reference scale for niche breadth: 0–0.39 low, 0.4–0.6 intermediate, 0.61–1.0 high (modified from Grossman, 1986).]
Pianka's index niche overlap value (INO) a and Monte-Carlo simulation P-value for four examined species inhabiting Cochin Estuary [a INO > 0.60, biologically significant].
All Figures
|
Fig. 1 Location of examined species sampling sites (S) in Cochin estuary. |
| In the text | |
|
Fig. 2 Predator feeding strategy diagram of examined species from the Cochin Estuary (following Amundsen et al., 1996). |
| In the text | |
Current usage metrics show cumulative count of Article Views (full-text article views including HTML views, PDF and ePub downloads, according to the available data) and Abstracts Views on Vision4Press platform.
Data correspond to usage on the plateform after 2015. The current usage metrics is available 48-96 hours after online publication and is updated daily on week days.
Initial download of the metrics may take a while.