| Issue |
Ann. Limnol. - Int. J. Lim.
Volume 57, 2021
|
|
|---|---|---|
| Article Number | 17 | |
| Number of page(s) | 7 | |
| DOI | https://doi.org/10.1051/limn/2021015 | |
| Published online | 21 September 2021 | |
Research article
Intermittent disturbance combined N and P adding favor colony size and abundance of Microcystis flos-aquae
1
School of Environment and Civil Engineering, Jiangnan University, Wuxi 214122, PR China
2
Nanjing Institute of Geography and Limnology, Chinese Academy of Sciences, Nanjing 210008, PR China
3
Freshwater Fisheries Research Center, CAFS, Wuxi 214128, PR China
* Corresponding author: This email address is being protected from spambots. You need JavaScript enabled to view it.
Received:
12
June
2021
Accepted:
1
September
2021
Abstract
Nutrients and disturbance are both important environmental factors in the freshwater ecosystem. Here we present data on the effects of intermittent disturbance (ID), nitrogen and phosphorus adding (+N+P), and intermittent disturbance combined N and P adding (ID+N+P) on colony size and abundance of Microcystis flos-aquae in lab experiments. Results showed that the mean colony sizes of M. flos-aquae in ID+N+P group were1.68, 1.56, 1.17 times that in the control, +N+P, ID groups, respectively. Moreover, the average number of M. flos-aquae in ID+N+P group were 1.47, 1.19, 1.42 times those in the control, +N+P, ID groups, respectively. The average concentration of EPS (extracellular polysaccharides) in ID and ID+N+P group was significantly higher than those in control and +N+P groups. Results demonstrated that intermittent disturbance combined N and P adding promoted colony size and abundance of M. flos-aquae. These results suggest that intermittent disturbance combined N and P adding plays an important role in the formation of Microcystis blooms in freshwater ecosystems.
Key words: Intermittent disturbance / phosphorus / nitrogen / Microcystis / EPS
© EDP Sciences, 2021
1 Introduction
Cyanobacterial blooms dominated by Microcystis spp. occur frequently in lakes, rivers, and reservoirs around the world (Xiao et al., 2018). Many species of Microcystis are toxic (Chorus and Bartram, 1999), thus blooms dominated by members of this genus can threaten drinking water safety and potentially harm human health (Guo, 2007). The high biomass of Microcystis during blooms can disturb the natural structure and function of microbial food webs, and degrade services provided by aquatic ecosystems (Paerl et al., 2011; Plaas and Paerl 2021).
When Microcystis blooms outbreak, lots of colonies of Microcystis assemble at the surface of water in a natural water (Qin et al., 2018; Zhu et al., 2016). Colonial Microcystis has faster vertical migration velocity (Nakamura et al., 1993), and has advantage in natural water when competition with other algae for more tolerant to high light intensity (Xu et al., 2017). Besides, colonial Microcystis is also considered a strategy for resisting zooplankton grazing (Yang et al., 2006), has advantages in the absorption of nutrients (Xiao et al., 2018), and is more resistant to physical water disturbances (Wu and Kong, 2009). Colonies play an important role in the formation of Microcystis blooms in river, reservoir, and lakes in freshwater ecosystem (Yamamoto et al., 2011; Zhu et al., 2014). Nevertheless, colonial Microcystis usually changes to single or two cells after several generations when isolated and cultured in lab (Yang et al., 2008). Thus, studies on the effects of various environmental factors on colony formation and colony size of Microcystis can provide a better understanding of Microcystis bloom formation (Zhu et al., 2016).
The mechanism how Microcystis shift from a single-cell to colony morphology has attracted a lot of attention. Many factors can induce the formation of colony Microcystis, including grazing by zooplankton (Burkert et al., 2001, Jang et al., 2003), the existence of heterotrophic bacteria (Shen et al., 2011), growth under nitrogen (Chu et al., 2007) or phosphorus (Yang, 2010) restriction, high concentrations of lead ions (Bi et al., 2013), the microcystin (Gan et al., 2012), low temperature and light intensity (Xu et al., 2016), and water disturbance (Zhong et al., 2019).
Hydrodynamic conditions play an important role in the horizontal and vertical distribution of Microcystis blooms (Qin et al., 2018). Besides, it was revealed that colony size and the abundance of Microcystis by disturbance depend on mode, intensity, and time of disturbance (O'Brien et al., 2004; Li et al., 2018; Zhong et al., 2019; Yang et al., 2020). Moreover, it was reported the mechanical action produced by water disturbances can cause changes in the physiology of Microcystis cells (Han et al., 2018; Liu et al., 2017). Nutrient is another important factor in the formation of Microyctis bloom. Numerous studies have focused on Microcystis bloom from the perspective of nutrients (mainly N and P), and have indicated N and P adding benefitted Micrcoysits bloom (Tang et al., 2018). The formation of a cyanobacterial bloom is determined by sufficient algal biomass, cellular buoyancy and hydrodynamic conditions (Reynolds, 2006). To date, the formation mechanism of Microcystis blooms is not completely clear. Based on field observations, Micrcoysits blooms do occur frequently in slow-flowing rivers and intermittently disturbed eutrophic lakes and reservoirs (Reynolds, 2006). How the Microcystis respond to intermittent disturbance, particularly associated with N and P adding, remains to be explored.
The purpose of this study had two objectives: (1) to determine the effect of intermittent disturbance combined N and P adding on the colony size of Microcystis, (2) to determine the effect of intermittent disturbance combined N and P adding on the abundance of Microcystis. This research results will helpful in understanding the formation mechanism of Microcystis blooms.
2 Materials and methods
2.1 Experiment setup
Microcystis flos-aquae is one of the dominant species of Microcystis in Lake Taihu in China. In Jun. 2017, we isolated single colony of M. flos-aquae from lake water in Meiliang Bay (dominated by Microcystis bloom) in Lake Taihu and cultured in BG-11 medium (Rippka et al., 1979). After Sept. 2017, unialgal cultures of M. flos-aquae were transferred to modified BG-11 medium (where TN=10 mg · L−1, TP = 0.5 mg · L−1). M. flos-aquae cultures consisted of a mixture of single-cells, double-cells and small colonies (∼0.773 × 10⁶ cells mL−1) until the beginning of the experiment. Taking 0.15 L M. flos-aquae in logarithmic growth period to 0.50 L Erlenmeyer flask. Four treatments were established in triplicate: control, N and P adding (+N+P) group, intermittent disturbance (ID) group, intermittent disturbance combined N and P adding (ID+N+P) group. Then, 0.15L BG-11 medium without N and P was added to the control and ID group. And 0.15L BG-11 medium with N and P (TN = 10 mg/L, TP = 0.5 mg/L) was added to the +N+P and ID+N+P group, respectively.
Next, control and +N+P group were put in incubator at 25 °C under cool fluorescent lights at an intensity of 40.5 mol m−2 s−1 with a light-dark period of 12:12 h until the end of experiment. In ID and ID+N+P group, disturbance intensity is set as 100 r/min (which approximate current velocities of 0.32m/s) (reference Zhong et al., 2019). ID and ID+N+P group were put on a shaker incubator (100 rpm) for 24 h at 25 °C under dark to simulate the effect of the disturbance induce by wind-wave on M. flos-aqua. Disturbance was generated on four horizontally oscillating shaking incubators (Zhong et al., 2019). After disturbance, ID and ID+N+P group were shift to the incubator. During the whole experiment period, ID and ID+N+P group were disturbed in the 1st, 5th, 9th, and 13th days for 24 h, and no disturbance in other time (reference Yang et al., 2020). The whole experiment lasted 17 days
Samples were collected on the 0th, 1st, 5th, 9th, 13th and 17th days in this experiment to measure total soluble nitrogen (DTN), total dissolved phosphorus (DTP), and orthophosphate (PO43–-P), EPS (extracellular polysaccharide), colony size and abundance of M. flos-aquae. The determination methods of the above indicators may be found in our previous studies (Zhong et al., 2019).
2.2 Statistical analysis
All the data obtained from the lab experiment was analyzed using SPSS 24.0 software. Statistically significant differences between the control and treatments were compared using one-way analyses of variance (ANOVA). In this study, P-value <0.05 is considered as statistically significant level.
3 Results
3.1 The nutrient paramenters and Chla
The mean value of DTN, DTP, NH4+-N, PO43−-P in +N+P and ID+N+P group were significantly higher than those in control and ID group (Tab. 1). However, the mean value of NH4+-N in +N+P and ID group were significantly higher than those in control and ID+N+P group (Tab. 1). The mean concentration of Chla in ID+N+P group was the highest among four treatment groups.
During this experiment, the concentration of DTN, DTP, NH4+-N, PO43–-P in all treatment group decreased (Fig. 1a, b, c, e). However, the concentration of Chla in +N+P and ID+N+P group increased during this experiment (Fig. 1f). No obvious law was found about the concentration variation of NH4+-N in all treatment group (Fig. 1d).
The mean value of nutrient paramenters and Chla in different treatments.
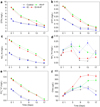 |
Fig. 1 The variation of DTN (a), DTP (b), PO43− (c) and Chla (d) with time during this lab experiment. ID = Intermittent disturbance, N = nitrogen, P = phosphorus. a = DTN, b = DTP, c = NO3−-N, d = NH4+-N, e = PO43−-P, f = Chla. |
3.2 Colony size of Microcystis flos-aquae
As shown in Figure 2a, the average colony size of M. flos-aquae was 32.22 (±1.65), 34.65 (±1.71), 46.56 (±2.11), 54.32 (±2.82) µm in control, +N+P, ID, and ID+N+P groups, respectively. The average colony size of M. flos-aquae in ID and ID+N+P group were significantly higher than those in the control and +N+P group (P < 0.05). Moreover, the mean colony size of M. flos-aquae in ID+N+P group was significantly higher than that in ID group (P < 0.05).
In addition, the biggest coloy sizes of M. flos-aquae in ID and ID+N+P group was 52.56, 65.31 µm on 9th day, respectively (Fig. 2b). However, in control and +N+P group, the biggest coloy sizes of M. flos-aquae in control (35.59 µm) and +N+P (36.53 µm) group was found on 1st day (Fig.2b). At the end of the experiment, the mean size of M. flos-aquae colony was 30.17 (±1.62), 33.67 (±1.67), 50.27 (±2.28), 63.91 (±3.21) µm in control, +N+P, ID, and ID+N+P group, respectively (Fig. 2b). The mean colony size of M. flos-aquae in ID+N+P group was significantly higher than those in control, +N+P, and ID group (P < 0.05). Our result indicated that intermittent disturbance benefited the colony size of M. flos-aquae in this experiment.
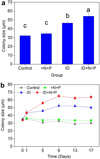 |
Fig. 2 The average colony size (a) and colony size variation (b) of M. flos-aquae with time during the lab experiment. ID = Intermittent disturbance, N = nitrogen, P = phosphorus. The different letters a, b, c indicates significant differences (P < 0.05). |
3.3 Abundance of M. flos-aquae
In the lab experiment, the mean algal density of M. flos-aquae was 9.19 (±0.45), 11.37 (±0.57), 9.53 (±0.43), 13.57 (±0.81) × 108 cells/L in control, +N+P, ID, and ID+N+P group, respectively (Fig. 3a). The average algal density of M. flos-aquae in ID+N+P group was significantly higher than those in other three treatment groups (P < 0.05).
Besides, the algal density of M. flos-aquae in ID+N+P group increased 2.24 times from 7.81 × 10⁸ cells/L to 17.47 × 10⁸ cells/L on 13 days. However, the algal density of M. flos-aquae in control and ID group increased 1.17 and 1.03 times at the end of experiment, respectively. This result showed that intermittent disturbance combined N and P adding promoted the abundance accumulation of M. flos-aquae in this experiment.
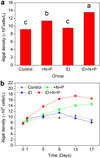 |
Fig. 3 The average algal density (a) and algal density variation (b) of M. flos-aquae with time during this lab experiment. ID = Intermittent disturbance, N = nitrogen, P = phosphorus. The different letters a, b, c indicates significant differences (P < 0.05). |
3.4 EPS concentration of M. flos-aquae
It was confirmed that EPS (extracellular polysaccharides) was important in colony formation of Microcystis (Yang et al., 2008). In this lab experiment, the average concentration of EPS was 1.07 (±0.012), 0.99 (±0.009), 1.78 (±0.074), 1.56 (±0.044) pg/cell in control, +N+P, ID and ID+N+P group, respectively (Fig. 4a). ANOVA analyzed showed that the average concentration of EPS of M. flos-aquae in ID and ID+N+P group was significantly higher than those in control and +N+P groups (P < 0.05) (Fig. 4a, b). Similarly, the sEPS (soluble extracellular polysaccharides) and bEPS (bound extracellular polysaccharides) of M. flos-aquae in ID and ID+N+P group were significantly higher than those in control and +N+P groups (P < 0.05) (Fig. 4a). The maximum concentration of EPS in ID group was 2.21 (±0.19) pg/cell at the end of the experiment (Fig. 4b). And the maximum concentration of EPS in ID+N+P group was found in the first day, with the concentration 1.97 (±0.16) pg/cell (Fig. 4b). The results showed that intermittent disturbance significantly promoted the release of EPS from M. flos-aquae cells.
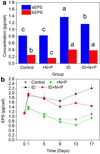 |
Fig. 4 The average concentration of sEPS and bEPS of M. flos-aqua during the lab experiment (a). The concentration variation of EPS of M. flos-aqua with time during the lab experiment (b). sEPS= soluble extracellular polysaccharides, bEPS = bound extracellular polysaccharides, ID = Intermittent disturbance, N= nitrogen, P = phosphorus. The different letters a, b, c indicates significant differences (P < 0.05). |
4 Discussion
4.1 Intermittent disturbance benefit the colony size of Microcystis
It was reported that colony size of Microcystis in Lake Taihu increased from 20.19 to 70.11 µm after disturbance for 24 h at current velocity of 0.53 cm/s in field condition (Yang et al., 2017). Besides, it was found that under lab culture disturbance (current velocity = 0.16–1.28 m/s) for one day, prompting an increase in colony size of M. flos-aquae at current velocity <0.32 ms−1 (Liu et al., 2017). It was confirmed that under lab culture conditions at current velocity <0.64 ms−1 is favorable for the colony aggregation of M. aeruginosa to form large colonies (Zhong et al., 2019). In recent, it was revealed that intermittent disturbance (turbulent dissipation rate = 2.98 × 10⁻⁶ m2 s−3) prompted an increase in colony size of Microcystis in microcosm condition (Yang et al., 2020). Above studies indicated the intermittent disturbance with appropriate intensity favor the colony size of Microcystis.
EPS are found in mucilage or the cell's sheath, and it is very important in colony formation in Microcystis (Yang et al., 2008; Li et al., 2013; Zhu et al., 2014). It was found that the concentration of EPS in Microcystis colonies was significantly higher than in single cells (Li et al., 2013). It was reported that the bEPS (bound extracellular polysaccharides) may prevent daughter cells from separating after cell division, while sEPS (soluble extracellular polysaccharides) may increase cell adhesiveness (Li et al., 2013). The average concentration of EPS of M. flos-aquae in ID and ID+N+P group was significantly higher than those in control and +N+P groups, which may explain why the average colony size of M. flos-aquae in ID and ID+N+P group were significantly higher than those in the control and +N+P group.
4.2 Intermittent disturbance combined N and P adding favored the abundance accumulation of Microcystis
Disturbance, a ubiquitous hydrodynamic feature of all inland waters and a highly variable environmental parameter, was generated at the surface or by natural processes (Kang et al., 2019). Disturbance promotes or inhibits the primary production of phytoplankton by changing the light environment and nutrient supply (Macintyre and Jellison, 2001; Zhang et al., 2004).
Disturbance can reduce the concentration of waste products or metabolites released from cells, which reduced their potential inhibitory effects to algae. However, disturbance will bring harm for growth of algae when disturbance exceeds a certain threshold. On the one hand, disturbance produces an unstable water movement environment, which is disadvantage for the growth of algal cells (Yan et al., 2008). On the other hand, considering the shear forces, disturbance can lead to mechanical damage to algal cells, inhibit or reduce the division of algal cells, and change cell morphology and physiological activities (Karp-Boss et al., 2000). It was confirmed that the disturbance intensity (0.32 m/s in this experiment) was favorable for the abundance accumulation of Microcystis in lab condition (Zhong et al., 2019). Moreover, it was found that intermittent disturbance benefited the abundance increasing of Microcystis in field (Yang et al., 2020). In addition, N and P concentration (TN = 10 mg · L−1, TP = 0.5 mg · L−1 in this experiment) are favorable for cell division and growth of Microcystis, including the single-cells, paired-cells and colonies Microcystis (Xu et al., 2014). Therefore, intermittent disturbance combined N and P adding promoted abundance increase of M. flos-aquae in this lab experiment.
4.3 Significance for Microcystis in natural phytoplankton community
Microcystis can float or sink to obtain the optimal light by gas vacuolation according to the underwater light intensity (Reynolds, 1984). Colonial Microcystis has faster vertical migration velocity (Nakamura et al., 1993), and has advantage in natural water when competition with other algae for more tolerant to high light intensity (Xu et al., 2017). Besides, colonial Microcystis has advantages in the absorption of nutrients (Xiao et al., 2018), and is more resistant to physical water disturbances (Wu and Kong, 2009). In this experiment, the larger colony morphology of Microcystis in ID+N+P group has advantage for Microcystis to get the dominant position in the competition with other algae.
Zooplankton is the main predators of phytoplankton and prefers to feed on the small individuals of algae. In this study, ID +N+P group were associated with larger Microcystis colonies. Large colonies of Microcystis are so big that it is impossible to be fed by zooplankton (Oliver and Ganf, 2000), which bring further advantage for Microcystis in competition with others algae. Nevertheless, because of single cell and small colony morphology of Microcystis was easily grazed by zooplankton in the control and +N+P group. Thus, large colonial Microcystis can have an advantage relative to other algae under pressure from grazers. In the ID+N+P group, enough N and P support the growth and reproduction of Microcystis (Fig. 2a, b). Therefore, intermittent disturbance combined N and P adding was important in ensuring the dominance of Microcystis in natural phytoplankton community.
5 Conclusions
The effects of intermittent disturbance, N and P, intermittent disturbance combined N and P adding on M. flos-aquae were studied in lab condition. The abundance, colony size of M. flos-aquae were determined. The main results are as followings: (1) ID+N+P favored the colony size increasing of M. flos-aquae, (2) ID+N+P benefited the abundance accumulation of M. flos-aquae. Our research results finally confirmed that intermittent disturbance combined N and P adding played important effect during the formation of Microcystis blooms in freshwater ecosystem.
Declaration of interest statement
No potential conflict of interest was reported by the authors.
Acknowledgements
This study was funded by Central Public-interest Scientific Institution Basal Research Fund, CAFS (NO. 2018HY-ZD04).
References
- Bi XD, Zhang SL, Dai W, Xing KZ, Yang F. 2013. Effects of lead (II) on the extracellular polysaccharide (EPS) production and colony formation of cultured Microcystis aeruginosa. Water Sci Technol 67: 803–809. [CrossRef] [PubMed] [Google Scholar]
- Burkert U, Hyenstrand P, Drakare S, Blomqvist P. 2001. Effects of the mixotrophic flagellate Ochromonas sp. on colony formation in Microcystis aeruginosa. Aquat Ecol 35: 11–17. [CrossRef] [Google Scholar]
- Chorus EI, Bartram J. 1999. Toxic Cyanobacteria in Water: A Guide to their Public Health Consequences, Monitoring and Management. London: Taylor & Francis. [CrossRef] [Google Scholar]
- Chu Z, Jin X, Yang B, Zeng QR. 2007. Buoyancy regulation of Microcystis flos-aquae during phosphorus-limited and nitrogen-limited growth. J Plankton Res 29: 739–745. [CrossRef] [Google Scholar]
- Gan N, Xiao Y, Zhu L, et al. 2012. The role of microcystins in maintaining colonies of bloom-forming Microcystis spp. Environ Microbiol 14: 730–742. [CrossRef] [PubMed] [Google Scholar]
- Guo L. 2007. Doing battle with the green monster of Taihu Lake. Science 317: 1166–1166. [Google Scholar]
- Han LH, Yang GJ, Liu Y, Qin BQ, Zhong CN, Yang HW. 2018. Effect of disturbance intensity on the growth and chlorophyll fluorescence of Microcystis flos-aquae colony in Lake Taihu. Res Environ Sci 31: 265–272. [Google Scholar]
- Jang MH, Ha K, Joo GJ, Takamura N. 2003. Toxin production of cyanobacteria is increased by exposure to zooplankton. Freshw Biol 48: 1540–1550. [CrossRef] [Google Scholar]
- Kang L, He YX, Dai LC, et al. 2019. Interactions between suspended particulate matter and algal cells contributed to the reconstruction of phytoplankton communities in turbulent waters. Water Res 149: 251–262. [PubMed] [Google Scholar]
- Karp-Boss L, Boss E, Jumars PA. 2000. Motion of dinoflagellates in a simple shear flow. Limnol Oceanogr 45: 1594–1602. [CrossRef] [Google Scholar]
- Li M, Xiao M, Zhang P, Hamilton DP. 2018. Morphospecies-dependent disaggregation of colonies of the cyanobacterium Microcystis, under high turbulent mixing[J]. Water Res 141: 340–348. [CrossRef] [PubMed] [Google Scholar]
- Li M, Zhu W, Gao L, Lu L. 2013. Changes in extracellular polysaccharide content and morphology of Microcystis aeruginosa at different specific growth rates. J Appl Phycol 25: 1023–1030. [CrossRef] [Google Scholar]
- Liu Y, Yang G, Han L, Qin BQ, Zhong CN, Yang HW. 2017. Effects of different disturbance intensity on the colony size of Microcystis flos-aquae in Lake Taihu. Ecol Environ Sci 26: 1961–1968. [Google Scholar]
- Macintyre S, Jellison R. 2001. Nutrient fluxes from upwelling and enhanced turbulence at the top of the pycnocline in Mono Lake, California. Hydrobiologia 466: 13–29. [CrossRef] [Google Scholar]
- Nakamura T, Adachi Y, Suzuki M. 1993. Flotation and sedimentation of a single Microcystis floc collected from surface bloom. Water Res 27: 979–983. [CrossRef] [Google Scholar]
- O'Brien KR, Meyer DL, Waite AM, Ivey GN, Hamilton DP. 2004. Disaggregation of Microcystis aeruginosa, colonies under turbulent mixing: laboratory experiments in a grid-stirred tank. Hydrobiologia 519: 143–152. [CrossRef] [Google Scholar]
- Oliver RL, Ganf GG. 2000. Freshwater blooms. Dordrecht: Kluwer Academic Publishers, 149–194. [Google Scholar]
- Paerl HW, Hall NS, Calandrino ES. 2011. Controlling harmful cyanobacterial blooms in a world experiencing anthropogenic and climatic-induced change. Sci Total Environ 409: 1739–1745. [PubMed] [Google Scholar]
- Plaas HE, Paerl HW. 2021. Toxic cyanobacteria: a growing threat to water and air quality. Environ Sci Technol 55: 44–64. [PubMed] [Google Scholar]
- Qin BQ, Yang GJ, Ma JR, et al. 2018. Spatiotemporal changes of cyanobacterial bloom in large shallow Eutrophic Lake Taihu, China. Front Microbiol 9. [PubMed] [Google Scholar]
- Reynolds CS. 1984. The Ecology of Freshwater Phytoplankton. Cambridge: Cambridge University Press. [Google Scholar]
- Reynolds CS. 2006. Ecology of Phytoplankton. Cambridge: Cambridge University Press, 1–435. [Google Scholar]
- Rippka R, Deruelles J, Waterbury J, Herdman M, Stanier R. 1979. Generic assignments, strain histories and properties of pure cultures of cyanobacteria. J Gen Microbiol 111: 1–61. [Google Scholar]
- Shen H, Niu Y, Xie P, Tao M, Yang X. 2011. Morphological and physiological changes in Microcystis aeruginosa as a result of interactions with heterotrophic bacteria. Freshw Biol 56: 1065–1080. [CrossRef] [Google Scholar]
- Tang XM, Krausfeldt LE, Shao K, et al. 2018. Seasonal gene expression and the ecophysiological implications of toxin Microcystis aeruginosa blooms in Lake Taihu. Environ Sci Technol 52: 11049–11059. [PubMed] [Google Scholar]
- Wu X, Kong F. 2009. Effects of light and wind speed on the vertical distribution of Microcystis aeruginosa colonies of different sizes during a summer bloom. Int Rev Hydrobiol 94: 258–266. [CrossRef] [Google Scholar]
- Xiao M, Li M, Reynolds CS. 2018. Colony formation in the cyanobacterium Microcystis. Biol Rev Camb Philos Soc 93: 1399–1420. [PubMed] [Google Scholar]
- Xu F, Zhu W, Xiao M, Li M. 2016. Interspecific variation in extracellular polysaccharide content and colony formation of Microcystis spp. cultured under different light intensities and temperatures. J Appl Phycol 28: 1533–1541. [CrossRef] [Google Scholar]
- Xu HP, Yang GJ, Zhou J, et al. 2014. Effect of nitrogen and phosphorus concentration on colony growth of Microcystis flos-aquae in Lake Taihu. J Lake Sci 26: 213–220. [CrossRef] [Google Scholar]
- Xu S, Yang Y, Xu J, Shi JQ, Song LR, Wu ZX. 2017. The physiological response of colonial and single-celled form of Microcystis to short-term high stress. Acta Hydrob Sinica 41: 443–447. [Google Scholar]
- Yamamoto Y, Shiah FK, Chen YL. 2011. Importance of large colony formation in bloom-forming cyanobacteria to dominate in eutrophic ponds. Ann Limnol Int J Lim 47: 167–173. [CrossRef] [Google Scholar]
- Yan RR, Pang Y, Chen XF, Zhao W, Ma J. 2008. Effect of disturbance on growth of Microcystis aeruginosa in different nutrient levels. Environ Sci 29: 63–67. [Google Scholar]
- Yang GJ, Tang XM, Wilhelm SW, et al. 2020. Intermittent disturbance benefits colony size, biomass and dominance of Microcystis in Lake Taihu under field simulation condition. Harmful Algae 99: 101909. [PubMed] [Google Scholar]
- Yang GJ, Zhong CN, Qin BQ, Wang YB, Wang XP, 2017. Effects of in-situ simulative mixing on colony size of Microcystis in Lake Taihu. J Lake Sci 29: 363–368 [CrossRef] [Google Scholar]
- Yang Z. 2010. Study on the driving factors of colony formation in Mircocystis [Dissertation]. Beijing: University of Chinese Academy of Sciences. [Google Scholar]
- Yang Z, Kong F, Shi X, et al. 2008. Changes in the morphology and polysaccharide content of Microcystis aeruginosa (Cyanobacteria) during flagellate grazing. J Phycol 44: 716–720. [CrossRef] [PubMed] [Google Scholar]
- Yang Z, Kong F, Shi X, Cao H. 2006. Morphological response of Microcystis aeruginosa to grazing by different sorts of zooplankton. Hydrobiologia 563: 225–230. [CrossRef] [Google Scholar]
- Zhang YL, Qin BQ, Chen WM, Gao G. 2004. Experimental study on underwater light intensity and primary productivity caused by variation of total suspended matter. Adv Water Sci 5: 615–620. [Google Scholar]
- Zhong CN, Yang GJ, Qin BQ, et al. 2019. Effects of mixing intensity on colony size and growth of Microcystis aeruginosa. Ann Limnol Int J Lim 55: 12 [CrossRef] [Google Scholar]
- Zhu W, Li M, Luo Y, et al. 2014. Vertical distribution of Microcystis colony size in Lake Taihu: its role in algal blooms. J Great Lake Res 40: 949–955. [CrossRef] [Google Scholar]
- Zhu W, Zhou XH, Chen HM, Li G, Xiao M, Li M. 2016. High nutrient concentration and temperature alleviated formation of large colonies of Microcystis: Evidence from field investigations and laboratory experiments. Water Res 101: 167–175. [CrossRef] [PubMed] [Google Scholar]
Cite this article as: Yang G, Zhong C, Rui Z, Pan W, Liu G. 2021. Intermittent disturbance combined N and P adding favor colony size and abundance of Microcystis flos-aquae. Ann. Limnol. - Int. J. Lim. 57: 17
All Tables
All Figures
|
Fig. 1 The variation of DTN (a), DTP (b), PO43− (c) and Chla (d) with time during this lab experiment. ID = Intermittent disturbance, N = nitrogen, P = phosphorus. a = DTN, b = DTP, c = NO3−-N, d = NH4+-N, e = PO43−-P, f = Chla. |
| In the text | |
|
Fig. 2 The average colony size (a) and colony size variation (b) of M. flos-aquae with time during the lab experiment. ID = Intermittent disturbance, N = nitrogen, P = phosphorus. The different letters a, b, c indicates significant differences (P < 0.05). |
| In the text | |
|
Fig. 3 The average algal density (a) and algal density variation (b) of M. flos-aquae with time during this lab experiment. ID = Intermittent disturbance, N = nitrogen, P = phosphorus. The different letters a, b, c indicates significant differences (P < 0.05). |
| In the text | |
|
Fig. 4 The average concentration of sEPS and bEPS of M. flos-aqua during the lab experiment (a). The concentration variation of EPS of M. flos-aqua with time during the lab experiment (b). sEPS= soluble extracellular polysaccharides, bEPS = bound extracellular polysaccharides, ID = Intermittent disturbance, N= nitrogen, P = phosphorus. The different letters a, b, c indicates significant differences (P < 0.05). |
| In the text | |
Current usage metrics show cumulative count of Article Views (full-text article views including HTML views, PDF and ePub downloads, according to the available data) and Abstracts Views on Vision4Press platform.
Data correspond to usage on the plateform after 2015. The current usage metrics is available 48-96 hours after online publication and is updated daily on week days.
Initial download of the metrics may take a while.