| Issue |
Int. J. Lim.
Volume 59, 2023
|
|
|---|---|---|
| Article Number | 4 | |
| Number of page(s) | 10 | |
| DOI | https://doi.org/10.1051/limn/2023004 | |
| Published online | 26 April 2023 | |
Research article
Allelopathic effects of Egeria densa on the growth and morphology of Chlorella vulgaris
1
College of Fisheries, Henan Normal University, Xinxiang 453007, China
2
School of Software Engineering, Anyang Normal University, Anyang 455000, China
* Corresponding author: This email address is being protected from spambots. You need JavaScript enabled to view it.
; This email address is being protected from spambots. You need JavaScript enabled to view it.
; This email address is being protected from spambots. You need JavaScript enabled to view it.
Received:
5
August
2022
Accepted:
13
March
2023
Abstract
Interspecific interaction between submerged macrophytes and phytoplankton is of great significance in sustaining ecological balance and restoring eutrophic water regions. In consideration of the diversified algal density and macrophytes biomass, the present study selected two biomass levels of Egeria densa and gradient densities of Chlorella vulgaris for simulated cultivation experimentation. E. densa could significantly suppress the growth and affect the morphology of C. vulgaris. The allelopathically inhibitory growth of C. vulgaris was suggested to increase with increasing biomass of E. densa and decreased with the elevating density of C. vulgaris. Higher amount of colonies and bigger colony size of C. vulgaris were detected after the treatment with 5 g/L of E. densa together with C. vulgaris (OD680 = 0.2) and treatment with 10 g/L E. densa together with C. vulgaris (OD680 = 0.05). Elevated extracellular and intracellular polysaccharides were detected, which possibly contributed to the morphological changes of C. vulgaris induced by E. densa.
Key words: Allelopathy / Egeria densa / morphology / Chlorella vulgaris / growth
Co-first authors.
© EDP Sciences, 2023
1 Introduction
As an important primary producer and a key biological factor in sustaining the healthy function of aquatic ecosystems, the submerged macrophytes can assist in purification and improvement of water transparency, can provide a good habitat for invertebrates and can shape phytoplankton community structure (Amorim and Moura, 2020). The occurrence of eutrophication and cyanobacterial blooms is closely related to the decline of submerged plants in recent decades (Qin, 2020). Indoor and field experiments have shown that the chemically active substances secreted by submerged plants, including polyphenols, fatty acids, terpenes and alkaloids, could significantly inhibit the growth of cyanobacteria, especially Microcystis (Techer et al., 2016; Santonja et al., 2018; Li et al., 2021). However, considerable controversial results exist in the effects of submerged macrophytes on green algae (Pakdel et al., 2013; Santonja et al., 2018). Some studies did not detect significant inhibition on green algae by submerged macrophytes (Hong and Hu, 2007; Hilt and Gross, 2008; Zhu et al., 2010; Pakdel et al., 2013; Jeong et al., 2021; Zhu et al., 2021). Instead, chlorophytes were stimulated by allelochemicals (Jasser, 1995; Mulderij et al., 2007). Toporowska et al. (2008) found that green algae dominated in the water regions with abundant Ceratophyllum demersum or Potamogeton lucens. Similarly, our previous analysis of historical phytoplankton changes in Lake Dianchi (Kunming, China) also indicated that during the period in which the submerged macrophytes were many, it was the green algae, such as Scenedesmus, Pediastrum and Coleastrum, that dominated (Dong et al., 2014). However, Najas minor and Potamogeton malaianus could significantly suppress the growth of Scenedesmus obliquus (He et al., 2008). Combined with the previous studies, it was assumed that the contradicting results depend on species-specific interaction, algal density and macrophyte biomass (Zhao et al., 2012; Jiang et al., 2015; Zuo et al., 2015; Dong et al., 2018). Therefore, in consideration of diversified density distribution of phytoplankton in natural shallow freshwater ecosystems, the interactions between algae with varying densities and gradient biomass of aquatic macrophytes should be discussed to comprehensively evaluate the allelopathic effects on aquatic ecosystems (Zheng et al., 2013; Jiang et al., 2015; Zuo et al., 2015; Donadi et al., 2019; Nezbrytska et al., 2022).
Similar to cyanobacteria, fierce competition also exists between green algae and submerged macrophytes. So, what is the ecological strategy for coexistence of green algae and submerged macrophytes in some water regions? The traditional environmental toxicology research focuses on the environmental stress on growth, photosynthetic activities, oxidative ability and membrane damage of the target algae (Körner and Nicklisch, 2002; Leu et al., 2002; Dziga et al., 2007; Hong et al., 2008; Zhu et al., 2010). However, an increasing number of studies indicated that morphological transformation is more sensitive to environmental pressure than the growth effects. Lürling and Beekman (2002) found that growth inhibition concentration of ionic surfactants originating from the glass fibre, hybrid fibre and nitrocellulose membrane was far below than that causing the morphological changes on S. obliquus. Huang et al. (2016) suggested that low concentration of free Cu2+ had no significant effects on algal growth and photosynthesis but can inhibit S. obliquus to form colonies in response to Daphnia filtrate. Cheloni and Slaveykova (2021) measured the effects of four kinds of micropollutants (paraquat, perfluorooctane sulfonic acid,as well as heavy metal cadmium and copper) on Chlamydomonas reinhardtii. The chlorophyll fluorescence, oxidative stress and membrane injury of C. reinhardtii were not detected in the micropollutant concentration-induced colony formation. Zhu et al. (2021) revealed that the algal morphology was more sensitive than growth for indicating the phytoplankton's response to allelochemicals from macrophytes. Accordingly, in environmental studies, the growth rates effects and the morphological changes should be considered to better assess phytoplankton response.
Related studies have reported that colony responses to adverse conditions could significantly improve the resistance of target green algae to predation by zooplankton (Boraas et al., 1998; Wu et al., 2013; Zhu et al., 2015; Fisher et al., 2016; Lürling, 2021), global warming (Duan et al., 2018; Zhu et al., 2019), environmental pollutants (Liu et al., 2010; Li et al., 2013; Cheloni and Slaveykova, 2021) and competition with macrophytes (Dong et al., 2018; Dong et al., 2019; Zhu et al., 2021). However, ecological costs also exist in the colony formation of green algae. Owing to induced colony formation, the sedimentation rates of the target algae into the bottom water increased, and the growth was limited by low temperature and little light at the bottom water region (Mulderij et al., 2005; Dong et al., 2013). Therefore, in inter-specific relationships of predation and competition, the morphology of phytoplankton may indirectly affect the structure of food web, and the morphology dynamics of phytoplankton would further exert profound effects on the function of aquatic ecosystems.
To increase the knowledge towards the comprehensive influences of submerged macrophytes on green algae, the macrophyte Egeria densa and green algae Chlorella vulgaris naturally occurring in fresh water ecosystems were selected in the present study. The present study aimed to compensate for the limited knowledge on algal morphological plasticity and responses of green algae with gradient density to different biomass levels of submerged macrophytes.
2 Materials and methods
2.1 Algae culture
The green algae strain C. vulgaris (FACHB-8) was obtained from Freshwater Algae Culture Collection of Institute of Hydrobiology, Chinese Academy of Sciences in Wuhan, China. Prior to experimentation, the stock cultures of C. vulgaris were conducted under favourable conditions at room temperature (25 °C) in 500 mL Erlenmeyer flasks with 300 mL BG11 medium (Rippka et al., 1979) under a 12 h light:12 h dark cycle (25 µmol photons s−1 m−2). The cultures were shaken thrice in one day to prevent algal sedimentation.
2.2 The acclimation of macrophytes
The submerged macrophytes E. densa were collected from a field pond for growth of experimental macrophytes in Henan Normal University, China (35°19ʹ38.363ʹʹN, 113° 54ʹ09.482ʹʹ E) and were carefully rinsed with tap water to remove all adhering epiphytes and zooplankton (Lürling et al., 2006). Then, the plants were acclimated with C. vulgaris to simulate the co-existence of the target algae and macrophytes. The cultivation conditions were the same as those mentioned above. Finally, robust and isometric shoots (Lürling et al., 2006) of the submerged E. densa were selected for experimentation after careful rinsing with sterile water.
2.3 Experimental design
When it reached an exponential growth phase, C. vulgaris was cultivated in three 2 L flasks with 1.8 L of fresh BG11 medium under a 12 h:12 h light cycle (25 µmol photons s−1 m−2). The initial algal density was set as follows: Flask one = 0.05 (OD680); Flask two = 0.1; and Flask three = 0.2. Subsequently, each algal cultivation in 2 L flask with different initial algal densities was divided into nine 250 mL Erlenmeyer flasks with 200 mL of the algal solution per flask on average and further cultivated in the presence or absence of submerged E. densa (5 g FW L−1 or 10 g FW L−1).The control (with one or two E. densa-like plastic plants to exclude the potential shading effects of the macrophytes) and macrophytes treatment (5 g FW L−1 or 10 g FW L−1) were set in triplicate. All the cultivation flasks with three replicates were covered with parafilm and cultivated under favourable conditions as described above. The whole experiments lasted for 10 days. Each alga culture was sampled regularly to measure nutrients in the cultivation medium and the growth, photosynthetic pigments, soluble intracellular (and extracellular) polysaccharides, colony proportion and average cell numbers per colony of C. vulgaris.
2.4 Parameters measurements
2.4.1 Measurement of total dissolved nitrogen (TDN) and phosphorous (TDP)
The concentrations of TDN and TDP were measured according to Protocols for Standard Observation and Measurement in Aquatic Ecosystems of Chinese Ecosystem Research Network (CERN) (Huang et al., 2000; Cai, 2007).
2.4.2 Optical density (OD680)
The growth of C. vulgaris was determined by its OD680 under ultraviolet/visible spectrophotometer.
2.4.3 Photosynthetic pigments
Samples (5 mL) were centrifuged under 12 000 rpm for 10 min. The centrifuged algae cell were extracted with 95% ethanol for 24 h at 4 °C in the dark. Shaking was performed after extraction for 12 h to fully extract the pigments. Then, all the extracted substances were centrifuged, and 3 mL supernatant was measured by using an ultraviolet/visible spectrophotometer. The absorbance values at 665 and 649 nm (A665 and A649, respectively) were measured, and the concentrations of photosynthetic pigment chlorophyll a (Chla) were calculated as follows (Lichtenthaler and Buschmann, 2001):
Chla (mg/L) = 13.95×A665-6.88×A649 (1)
2.4.4 Algal density and the morphology composition
Samples (2 mL) were fixed with Lugol's fixative and viewed under an inverted microscope to count the cell density, the number of cells per colony and the colony proportion (minimum of three cells) (Lürling and Van Donk, 1997).
2.4.5 Inhibition on C. vulgaris by E. densa
The inhibition rate of C. vulgaris and S. obliquus in the treatment groups compared with the control at the end of the experiment were measured as follows:
I(%) = (Ct − Cc) / Cc × 100%,
where Cc and Ct represent the (OD680, algal density, Chla) contents of C. vulgaris in the control and each treatment group, respectively.
2.4.6 Intracellular and extracellular polysaccharides
Algal solutions (3 mL) in each group were sampled regularly and centrifuged at a speed of 8000 rpm for 10 min. The supernatant was harvested to determine the extracellular polysaccharide. The centrifuged algal deposits were washed with sterile water and boiled for 30 min to ensure that the intracellular polysaccharide were sufficiently extracted from the cell. The procedure for determination of intracellular and extracellular polysaccharides were conducted according to anthrone colorimetry methods in accordance with Li et al. (2000).
2.5 Statistical analysis
Mean values and standard deviations were calculated for the different replicates (n = 3). Two-way ANOVA was conducted to test the differences for nutrients changes and algal inhibition in each treatment. Repeated measurement of ANOVA was utilised to compare the colony proportion, average cell number per colony, soluble intracellular and extracellular polysaccharide among different algal density and E. densa treatments. All the statistical analyses employed SPSS 22.0 for Windows. A value of p < 0.05 was considered statistically significant in all analyses.
3 Results
3.1 Content of TDN and TDP
As illustrated in Figure 1, the contents of TDN and TDP in the co-cultivation of C. vulgaris with 10g/L E. densa were higher than those of the control without macrophytes (Figs. 1a and 1b). In consideration of responses owing to diversified algal density, the reduction of TDP in groups with high algal density (OD680 = 0.2) was more significant than that of lower ones (OD680 = 0.05 and OD680 = 0.1) (Fig. 1b). Two-way ANOVA indicated that treatment with E. densa exerted significant influences on the content of TDN at the end of the experimentation, whereas the effects of initial algal density were not obvious in each treatment (F = 2.432, P = 0.116). The result also demonstrated the significant influences of treatment (F = 250.650, P < 0.001) and initial algal density (F = 75.434, P < 0.001) on the content of TDP at the end of the experimentation (Tab. 1).
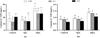 |
Fig. 1 The content of TDN and TDP in cultivation of C. vulgaris with or without E. densa at the end of the experimentation. |
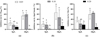 |
Fig. 2 Inhibition rate on OD680, algal density and Chla of C. vulgaris induced by E. densa at the end of the experimentation. |
Summary of two-Way ANOVA analysis on the effects of algal density, biomass of E. densa and their interaction on the nutrients (TDN, TDP) in algal cultivation and inhibition on C. vulgaris by E. densa at the end of the experimentation
Repeated measurement analysis of variance comparing algal morphology (Colony proportion and cell number per colony), soluble intracellular polysaccharide and extracellular polysaccharide under gradient initial algal cultivation density and different biomass of E. densa during the experimental period.
3.2 Inhibition on C. vulgaris by E. densa
The presence of E. densa could significantly inhibit the growth of C. vulgaris, as indicated by OD680, algal density together with Chla Figure 2. Two-way ANOVA indicated that treatment with E. densa and initial algal density both exerted significant influences on the algal inhibition of OD680 (F = 33.519, P < 0.001; F = 40.394, P < 0.001), density (F = 11.259, P < 0.01; F = 6.371, P < 0.05) and Chla (F = 21.002, P < 0.01; F = 29.294, P < 0.001) (Tab. 1). The inhibition influences induced by E. densa depended on target algal density and macrophyte biomass, increased with increasing amount of E. densa and decreased with increasing algal density.
3.3 Morphological changes of C. vulgaris
3.3.1 Average cell number per colony
By using Repeated Measurement ANOVA, it was suggested that Treatment (F = 179.236, P < 0.001), Initial algal density (F = 16.922, P < 0.001), Day (F = 15.205, P < 0.001), Treatment × Day (F = 9.765, P < 0.001), Initial algal density × Day (F = 2.425, P < 0.05) and Treatment × Density (F = 25.205, P < 0.01) all exerted significant influences on the average cell number per colony of C. vulgaris (Tab. 2). As indicated in Figure 3, the presence of E. densa could significantly induce the colony formation of C. vulgaris, especially with 10 g/L E. densa. The biggest colony was detected in the group with an initial algal density of OD680 = 0.05 and OD680 = 0.1. The average cell number per colony was 9.38. However, in the presence of 5 g/L E. densa, only the group with an initial algal density of 0.2 exerted significant colony size increase compared with the control.
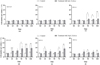 |
Fig. 3 The average cell number per colony of C. vulgaris with gradient concentration of initial algal cultivation density in the absence or presence of E. densa during the cultivation period. |
3.3.2 Colony proportion
By using repeated measurement ANOVA, it was suggested that Treatment (F = 204.366, P < 0.001), Initial algal density (F = 30.037, P < 0.001), Day (F = 68.040, P < 0.001), Treatment × Day (F = 9.178, P < 0.001) and Initial algal density × Day (F = 17.788, P < 0.001) all exerted significant influences on the colony proportion of C. vulgaris (Tab. 2). As indicated in Figure 4, the presence of E. densa could significantly increase the colony proportion of C. vulgaris. The highest number of colonies was detected in the group with initial algal density of OD680 = 0.2 in the presence of 5 g/L of E. densa. However, with 10 g/L of E. densa, the highest number of colonies was detected in the group with an initial algal density OD680 = 0.1.
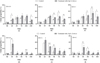 |
Fig. 4 The colony proportion of C. vulgaris with gradient concentration of initial algal cultivation density in the absence or presence of E. densa during the cultivation period. |
3.3.3 Soluble extracellular and intracellular polysaccharide
Resorting to Repeated Measurement ANOVA, it was suggested that Treatment (F = 57.955, P < 0.001; F = 80.733, P < 0.001;), Initial algal density (F = 21.772, P < 0.001; F = 16.331, P < 0.001;), Day (F = 33.756, P < 0.001; F = 43.445, P < 0.001;), Treatment × Day (F = 5.250, P < 0.001; F = 4.054, P < 0.001) and Initial algal density × Day (F = 7.841, P < 0.001; F = 2.273, P < 0.05) all exerted significant influences on the extracellular and intracellular polysaccharide in C. vulgaris (Tab. 2).
As illustrated in Figures 5 and 6, E. densa could elevate the contents of intracellular and extracellular polysaccharides in C. vulgaris in each group, and the effect increased with the biomass of E. densa. With 5 g/L of E. densa, algal density effects on soluble extracellular polysaccharide was not significant (Figs. 5a–5c), whereas soluble intracellular polysaccharide in the group of OD680 = 0.05 was higher than that of OD680 = 0.1 and OD680 = 0.2. In the presence of 10 g/L of E. densa, the increased extracellular polysaccharide in C. vulgaris was most significant in the group of initial algal density OD680 = 0.2, and the highest amount of intracellular polysaccharide was detected in the group of OD680 = 0.1.
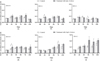 |
Fig. 5 The soluble extracellular polysaccharide in C. vulgaris with gradient concentration of initial algal cultivation density in the absence or presence of E. densa during the cultivation period. |
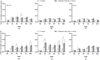 |
Fig. 6 The soluble intracellular polysaccharide in C. vulgaris with gradient concentration of initial algal cultivation density in the absence or presence of E. densa during the cultivation period. |
4 Discussion
4.1 Growth inhibition of E. densa on green algae C. vulgaris
When considering the allelopathic interaction between submerged macrophytes and phytoplankton in freshwater ecosystems, discussing the influences of shading and nutrient competition of macrophytes with target algae was inevitable. Many previous studies have discussed nutrient competition and the shading effects in co-cultivation experiments of submerged macrophytes-phytoplankton (Gross et al., 2003; Mulderij et al., 2007; Hilt and Gross, 2008; Lombardo et al., 2013; Jeong et al., 2021). We excluded shading effects by adding plastic-simulated plants as the control and also got rid of the nutrient depletion by using medium with sufficient nutrients. According to the nutrient analysis at the end of the experiment, TDN in each groups exhibited no significant differences, and TDP content was negatively correlated with initial algal density and positively related with macrophytes biomass. Therefore, considering the hypothesis that nutrient limitation would affect the allelopathic effects of submerged macrophytes on target organisms (Mulderij et al., 2007; Hilt and Gross, 2008; Jeong et al., 2021), it was necessary to pay attention to the nutrient changes in the co-existence cultivation systems.
Existing studies considerably discussed the inhibition effects on cyanobacteria induced by submerged macrophytes, especially for M. aeruginosa (Techer et al., 2016; Santonja et al., 2018; Li et al., 2021), whereas controversial results were reported on the effects of submerged macrophyte on green algae. One of the consensus was that cyanobacteria were the most sensitive to the allelochemicals from macrophytes that have been tested, followed by diatoms. Chlorophytes (green algae) are known to be less sensitive (Körner et al., 2002; Berger and Schagerl, 2004; Hilt and Gross, 2008; Pakdel et al., 2013; Jeong et al., 2021). Actually, whether the growth of green algae were stimulated or inhibited by submerged macrophytes depended on algal density and macrophytes biomass (Jiang et al., 2015). Our study comprehensively discussed the macrophytes biomass and algal density effects between the allelochemical interaction. E. densa could significantly inhibit the growth of C. vulgaris. Vanderstukken et al. (2011), Cristian et al. (2016) and Rodríguez et al. (2016) have also observed that the presence of E. densa had an adverse impact on the growth of Scenedesmus. Based on the fact that the biomass density of macrophytes was only about 10 g/L in the natural environment (Zhu et al., 2010), our present study demonstrated that E. densa could significantly suppress the growth of C. vulgaris, and the negative effects increased with increasing amount of macrophytes. Consistent with our expectation, the present study also indicated that the allelopathic inhibition of E. densa on C. vulgaris depended on algal density. The inhibition effects were reduced with high initial algal concentration. A related study by Jiang et al. (2015) also indicated that when the initial phytoplankton density was high (1.9 × 10⁸ cells/L), Hydrilla verticillata did not effectively control phytoplankton cell density. TDP content was negatively correlated with initial algal density. Thus, the lower allelopathic effects of the submerged macrophyte on phytoplankton with high density might be due to the combined effects of allelochemicals and phosphorus reduction. Previous studies have also demonstrated the lower allelopathic effects of M. verticillatum on cyanobacteria under phosphorus deficiency (Hilt, 2006; Hilt et al., 2006).
4.2 Morphological changes induced by E. densa
Submerged macrophytes could allelopathically affect phytoplankton, including their physiological processes, such as photosynthesis, respiration (Körner and Nicklisch, 2002; Zhu et al., 2010) and their antioxidant system (Wu et al., 2007; Hong et al., 2008). Distinct from the growth effects, Mulderij et al. (2005) firstly reported the induced colony formation of S. obliquus by aquatic macrophytes Stratiotes aloides. One recent study by Zhu et al. (2010) stated that although the exudates from Cabomba furcate, Nymphoides hydrophylla and Chara sp. had no significant effects on the algal growth of S. obliquus, the colony formation of the target algae was induced. The study firstly demonstrated that the morphological changes were better indicators of sensitivity to allelochemicals from macrophytes than the growth parameters. In the present study, we suggested that E. densa could also affect the morphology of C. vulgaris. The study results contradicted with those of Wu et al. (2007), who suggested that Potamogeton malaianus could inhibit the growth but did not induce morphological changes in S. obliquus. However, our previous study demonstrated the significantly induced colony formation of C. vulgaris (Dong et al., 2018; Dong et al., 2019) and S. obliquus (Dong et al., 2013) by Ceratophyllum demersum. The colony formation induced by allelochemicals might be specific to macrophytes and target algae species.
An obvious ecological cost of algal colony formation was the increased sedimentation rate (Lürling and van Donk, 2000; Lürling, 2003a: b). Compared with colonial algae, single cells could be maintained at the upper layer owing to their better buoyancy (Conway and Trainor, 1972). However, the growth of colonial algae was inhibited due to light and temperature limitations at the bottom water (Zhu et al., 2016; Albini et al., 2019). In addition, compared with single cells, the reduction ratio of surface area to volume in colonial cells also affected the nutrients absorption, called encapsulation effect (Kirk, 1994). One question emerges. Is it a mistake for green algae to form colonies when encountering allelochemicals from macrophytes? Colony formation of green algae can be an inducible defence mechanism against predation (Hessen and Van Donk 1993; Herron et al., 2019; Cheloni and Slaveykova, 2021; Lürling, 2021) in freshwater ecosystems. The ability to resist predation affects the algal survival directly and influences the trophic level via food chains (Van Donk, 2006; Van der Stap, 2007: 2008: 2009). In spite of increased sedimentation rate to bottom region, the competition between macrophytes and green algae could be alleviated. In addition, a previous study by Jeong et al. (2021) interpreted that allelochemicals produced by Myriophyllum spicatum could not penetrate the mucilage of colonial M. aeruginosa and Anabaena circinalis. Numerous studies have demonstrated that colony formation of green algae could increase their resistance to global warming (Zhu et al., 2019) and micropollutants (Cheloni and Slaveykova, 2021). The present study suggested that the morphology of C. vulgaris was sensitive to allelochemicals from E. densa, indicating the presence of ecological strategies utilised C. vulgaris when encountering allelochemicals.
4.3 How to form colonies?
In consideration of the ecological consequences induced by interspecific interaction, one issue emerges: how do the colonies form? In the present study, the colony proportion and cell number per colony of C. vulgaris (OD680 = 0.1) in the treatment with 10 g/L of E. densa were significantly higher than those of the control. Although many abiotic and biotic factors reportedly play roles in the colony formation of green algae, the inherent mechanisms are still unclear. One consensus was that the increased secretion of polysaccharide helps with cell adhesion and might be of great significance in the colony formation of green algae. Although no significant linear regression between the algal morphology and the content of polysaccharide was observed, it was indicated that the content of intracellular and extracellular polysaccharide per cell in C. vulgaris were elevated in the presence of E. densa during the whole cultivation period, especially in the treatment of C. vulgaris (OD680 = 0.1) by 10 g/L of E. densa with obvious algal morphological changes. The induced colony formation of green algae by abiotic and biotic factors were related to polysaccharide (Yang et al., 2010; Li et al., 2013; Bisova and Zachleder, 2014; Khona et al., 2016; Dong et al., 2018). The result was also verified by Liu et al. (2010), who demonstrated that the addition of glyoxylic acid could stimulate the polysaccharide production in S. obliquus, and the increased polysaccharide level was significantly positively correlated with the colony size of S. obliquus. Sun et al. (2020) indicated that the inhibitory expression of genes regulating the precursor synthesis during polysaccharide production could interrupt colony formation of S. obliquus.
Ethics approval and consent to participate
All authors agree with this submission.
Consent for publication
All authors agree with this publication.
Conflict of interest
The authors declare no conflicts of interest.
Funding information
This work was financially supported by the Young Backbone Teachers Project of Henan Province (No. 2020GGJS064), the National Natural Science Foundation of China (No. 31500380), the Scientific Fund of Henan Normal University (No. 2020QK02), the Major public welfare projects in Henan Province (No. 201300311300) and China Agriculture Research System (CARS-50).
References
- Albini D, Fowler MS, Llewellyn C, Tang KW. 2019. Reversible colony formation and the associated costs in Scenedesmus obliquus. J Plankton Res 41: 419–429. [CrossRef] [Google Scholar]
- Amorim CA, Moura AN. 2020. Effects of the manipulation of submerged macrophytes, large zooplankton, and nutrients on a cyanobacterial bloom: A mesocosm study in a tropical shallow reservoir. Environ Pollut 265: 114997. [CrossRef] [PubMed] [Google Scholar]
- Berger J, Schagerl M. 2004. Allelopathic activity of Characeae. Biologia (Bratisl) 59: 9–15. [Google Scholar]
- Bisova K, Zachleder V. 2014. Cell-cycle regulation in green algae dividing by multiple fission. J Exp Bot 65: 2585–2602. [CrossRef] [PubMed] [Google Scholar]
- Boraas ME, Seale DB, Boxhorn JE. 1998. Phagotrophy by a flagellate selects for colonial prey: a possible origin of multicellularity. Evol Ecol 12: 153–164. [CrossRef] [Google Scholar]
- Cai Q. 2007. Protocols for standard observation and measurement in aquatic ecosystems, Beijing: Chinese Environmental Science Press. [Google Scholar]
- Cheloni G, Slaveykova VI. 2021. Morphological plasticity in Chlamydomonas reinhardtii and acclimation to micropollutant stress. Aquat Toxicol 231: 105711. [CrossRef] [PubMed] [Google Scholar]
- Conway K, Trainor FR. 1972. Scenedesmus morphology and floatation. J Phycol 8: 138–143. [CrossRef] [Google Scholar]
- Cristian A, Sarma S, Nandini S. 2016. Allelopathic activity and chemical analysis of crude extracts from the macrophyte Egeria densa on selected phytoplankton species. Allelopath J 37: 147–160. [Google Scholar]
- Donadi S, Austin AN, Svartgren E, et al. 2019. Density-dependent positive feedbacks buffer aquatic plants from interactive effects of eutrophication and predator loss. Ecology 99: 2515–2524. [Google Scholar]
- Dong J, Chang MY, Li CL, et al. 2019. Allelopathic effects and potential active substances of Ceratophyllum demersum L. on Chlorella vulgaris Beij. Aquat Ecol 53: 651–663. [CrossRef] [Google Scholar]
- Dong J, Gao YN, Chang MY, et al. 2018. Colony formation by the green alga Chlorella vulgaris in response to the competitor Ceratophyllum demersum. Hydrobiologia 805: 177–187. [CrossRef] [Google Scholar]
- Dong J, Lu JJ, Li GB, et al. 2013. Influences of a submerged macrophyte on colony formation and growth of a green alga. Aquat Biol 19: 265–274. [CrossRef] [Google Scholar]
- Dong J, Yang K, Li SS, et al. 2014. Submerged vegetation removal promotes shift of dominant phytoplankton functional groups in a eutrophic lake. J Environ Sci 26: 1699–1707. [CrossRef] [PubMed] [Google Scholar]
- Duan ZP, Tan X, Parajuli K, et al. 2018. Colony formation in two Microcystis morphotypes: Effects of temperature and nutrient availability. Harmful Algae 72: 14–24. [PubMed] [Google Scholar]
- Dziga D, Suda M, Bialczyk J, et al. 2007. The alteration of Microcystis aeruginosa biomass and dissolved microcystin-LR concentration following exposure to plant-producing phenols. Environ Toxicol 22: 341–346. [CrossRef] [PubMed] [Google Scholar]
- Fisher RM, Bel T, West SA. 2016. Multicellular group formation in response to predators in the algae Chlorella vulgaris. J Evol Biol 29: 551–559. [CrossRef] [PubMed] [Google Scholar]
- Gross EM, Erhard D, Enikö I. 2003. Allelopathic activity of Ceratophyllum demersum L. and Najas marina ssp. Intermedia (Wolfgang) Casper. Hydrobiologia 506–509: 583–589. [CrossRef] [Google Scholar]
- He F, Deng P, Wu XH, et al. 2008. Allelopathic effects on Scenedesmus obliquus by two submerged macrophytes Najas minor and Potamogeton malaianus. Fresen Environ Bull 17: 92–97. [Google Scholar]
- Herron MD, Borin JM, Boswell JC, et al. 2019. De novo origins of multicellularity in response to predation. SciRep-UK 9: 2328. [Google Scholar]
- Hessen DO, Van Donk E. 1993. Morphological changes in Scenedesmus induced by substances released from Daphnia. Archiv für Hydrobiolog 127: 129 –140. [CrossRef] [Google Scholar]
- Hilt S. 2006. Allelopathic inhibition of epiphytes by submerged macrophytes. Aquat Bot 85: 252–256. [CrossRef] [Google Scholar]
- Hilt S, Ghobrial MGN, Gross EM. 2006. In situ allelopathic potential of Myriophyllum verticillatum (Haloragaceae) against selected phytoplankton species. J Phycol 42: 1189–1198. [CrossRef] [Google Scholar]
- Hilt S, Gross EM. 2008. Can allelopathically active submerged macrophytes stabilise clear-water states in shallow lakes? Basic Appl Ecol 9: 422–432 [CrossRef] [Google Scholar]
- Hong Y, Hu HY. 2007. Effects of the aquatic extracts of Arundodonax L. on the growth of freshwater algae. Allelopath J 20: 315–326. [Google Scholar]
- Hong Y, Hu HY, Xie X, et al. 2008. Responses of enzymatic antioxidants and nonenzymatic antioxidants in the cyanobacterium Microcystis aeruginosa to the allelochemical ethyl 2-methyl acetoacetate (EMA) isolated from reed (Phragmites communis). J Plant Physiol 165: 1264–1273. [CrossRef] [PubMed] [Google Scholar]
- Huang XF, Chen W, Cai Q. 2000. Survey, observation and analysis of lake ecosystem, Beijing: China Standard Press. [Google Scholar]
- Huang Y, Nan HH, Zhu XX, et al. 2016. Waterborne copper impairs grazer-induced colony formation and phytosynthetic efficiency in Scenedesmus obliquus. Limnol Oceanogr 61: 625–634. [CrossRef] [Google Scholar]
- Jasser I. 1995. The influence of macrophytes on a phytoplankton community in experimental conditions. Hydrobiologia 306: 21–32. [CrossRef] [Google Scholar]
- Jeong S, Yang DW, Joo SB, et al. 2021. Allelopathic inhibition effects of Myriophyllum spicatum on growths of bloom-Forming cyanobacteria and other phytoplankton species in coexistence experiments. J Plant Biol 64: 501–510. [CrossRef] [Google Scholar]
- Jiang H, Zhao DH, Zhao H, et al. 2015. Density-dependent interactions between Hydrilla verticillata (L. F.) Royle and phytoplankton: a mesocosm experiment. Clean-Soil, Air, Water 43 (12): 1623–1632. [CrossRef] [MathSciNet] [Google Scholar]
- Khona DK, Shirolikar SM, Gawde KK, et al. 2016. Characterization of salt stress-induced palmelloids in the green alga, Chlamydomonas reinhardtii. Algal Res 16: 434–448. [CrossRef] [Google Scholar]
- Kirk JTO. 1994. Light and photosynthesis in aquatic systems. Cambridge: Cambridge University Press. [CrossRef] [Google Scholar]
- Körner S, Nicklisch A. 2002. Allelopathic growth inhibition of selected phytoplankton species by submerged macrophytes. J Phycol 38: 862–871. [CrossRef] [Google Scholar]
- Leu E, Krieger-Liszkay A, Goussias C, et al. 2002. Polyphenolic allelochemicals from the aquatic angiosperm Myriophyllum spicatum inhibit photosystem II. Plant Physiol 130: 2011–2018. [CrossRef] [PubMed] [Google Scholar]
- Li BH, Yin YJ, Kang LF, et al. 2021. A review: Application of allelochemicals in water ecological restoration-algal inhibition. Chemosphere 267: 128869. [CrossRef] [PubMed] [Google Scholar]
- Li M, Zhu W, Dai XX, et al. 2013. Effects of linear alkylbenzene sulfonate on extracellular polysaccharide content and cells per particle of Microcystis aeruginosa and Scenedesmus obliquus. Fresen Environ Bull 22: 1189–1194. [Google Scholar]
- Lichtenthaler HK, Buschmann C. 2001. Chlorophylls and carotenoids: measurement and characterization by UV-VIS spectroscopy. In: Wrolstad RE, Acree TE, An H, et al. (eds.). Current Protocols in Food Analytical Chemistry. London: Wiley, pp., F4.3.1–F.4.3.8. [CrossRef] [Google Scholar]
- Liu Y, Wang W, Zhang M, et al. 2010. PSII-efficiency, polysaccharide production, and phenotypic plasticity of Scenedesmus obliquus in response to changes in metabolic carbon flux. Biochem Syst Ecol 38: 292–299. [CrossRef] [Google Scholar]
- Lombardo P, Mjelde M, Källqvist T, Brettum P. 2013. Seasonal and scale-dependent variability in nutrient- and allelopathy-mediated macrophyte-phytoplankton interactions. Knowl Manag Aquat Ecosyst 409: 10. [CrossRef] [EDP Sciences] [Google Scholar]
- Lürling M. 2003a. Phenotypic plasticity in the green algae Desmodesmus and Scenedesmus with special reference to the induction of defensive morphology. Ann Lim Int J Limnol 39: 85–101. [CrossRef] [EDP Sciences] [Google Scholar]
- Lürling M. 2003b. The effect of substances from different zooplankton species and fish on the induction of defensive morphology in the green alga Scenedesmus obliquus. J Plankton Res 25: 979–989. [CrossRef] [Google Scholar]
- Lürling M. 2021. Grazing resistance in phytoplankton. Hydrobiologia 848: 237–249. [CrossRef] [Google Scholar]
- Lürling M, Beekman W. 2002. Extractable substances (anionic surfactants) from membrane filters induced morphological changes in the green alga Scenedesmus obliquus (Chlorophyceae). Environ Toxicol Chem 21: 1213–1218. [CrossRef] [PubMed] [Google Scholar]
- Lürling M, Van Donk E. 1997. Morphological changes in Scenedesmus induced by infochemicals released in situ from zooplankton grazers. Limnol Oceanogr 42: 783–788. [CrossRef] [Google Scholar]
- Lürling M, Van Donk E. 2000. Grazer-induced colony formation in Scenedesmus: are there costs to being colonial? Oikos 88: 111–118. [CrossRef] [Google Scholar]
- Lürling M, Van Geest G, Scheffer M. 2006. Importance of nutrient competition and allelopathic effects in suppression of the green alga Scenedesmus obliquus by the macrophytes Chara, Elodea and Myriophyllum. Hydrobiologia 556: 209–220. [CrossRef] [Google Scholar]
- Mulderij G, Mooij WM, Van Donk E. 2005. Allelopathic growth inhibition and colony formation of the green alga Scenedesmus obliquus by the aquatic macrophate Stratiotes aloides. Aquat Ecol 39: 11–21. [CrossRef] [Google Scholar]
- Mulderij G, Mau B, van Donk E, et al. 2007. Allelopathic activity of Stratiotes aloides on phytoplankton-towards identification of allelopathic substances. Hydrobiologia 584: 89–100. [CrossRef] [Google Scholar]
- Nezbrytska I, Usenko O, Konovets I, et al. 2022. Potential use of aquatic vascular plants to control cyanobacterial blooms: a review. Water 14: 1727. [CrossRef] [Google Scholar]
- Pakdel FM, Sim L, Beardall J, et al. 2013. Allelopathic inhibition of microalgae by the freshwater stonewort, Chara australis, and a, submerged angiosperm, Potamogeton crispus. Aquat Bot 110: 24–30. [CrossRef] [Google Scholar]
- Qin BQ. 2020. Shallow lake limnology and control of eutrophication in Lake Taihu. J Lakes 32: 1229–1243 ( In Chinese). [Google Scholar]
- Rippka R, Deruelle J, Waterbury JB, et al. 1979. Generic assignments, strain histories and properties of pure cultures of cyanobacteria. J Gen Microb 111: 1–61. [Google Scholar]
- Rodríguez CAE, La Parra LRD, Téllez AM, et al. 2016. Allelopathic interactions between the macrophyte Egeria densa and plankton (alga, Scenedesmus acutus and cladocerans, Simocephalus spp.): a laboratory study. J Limnol 75: 151–160. [Google Scholar]
- Santonja M, Le Rouzic B, Thiébaut G. 2018. Seasonal dependence and functional implications of macrophyte-phytoplankton allelopathic interactions. Freshw Biol 63: 1161–1172. [CrossRef] [Google Scholar]
- Sun YF, Zhang XX, Zhang L, et al. 2020. UVB radiation suppresses antigrazer morphological defense in Scenedesmus obliquus by inhibiting algal growth and carbohydrate-regulated gene expression. Environ Sci Technol 54: 4495–4503. [CrossRef] [PubMed] [Google Scholar]
- Techer D, Fontaine P, Personne A, et al. 2016. Allelopathic potential and ecotoxicity evaluation of gallic and nonanoic acids to prevent cyanobacterial growth in lentic systems: a preliminary mesocosm study. Sci Total Environ 547: 157–165. [CrossRef] [PubMed] [Google Scholar]
- Toporowska M, Pawlik-Skowronska B, Wojtal AZ. 2008. Epiphytic algae on Stratiotes aloides L., Potamogeton lucens L., Ceratophyllum demersum L. and Chara spp. in a macrophyte-dominated lake. Oceanol Hydrobiol Stud 37: 51–63. [CrossRef] [Google Scholar]
- Van der Stap I, Vos M, Kooi BW, et al. 2009. Algal defenses, population stability and the risk of herbivore extinctions: a chemostat model and experiment. Ecol Res 4: 1145–1153. [CrossRef] [Google Scholar]
- Van der Stap I, Vos M, Mooij WM. 2007. Induced defenses in herbivores and plants differentially modulate a trophic cascade. Ecology 88: 2474–2481. [CrossRef] [PubMed] [Google Scholar]
- Van der Stap I, Vos M, Tollrian R, et al. 2008. Inducible defenses, competition and shared predation in planktonic food chains. Oecologia 157: 697–705. [CrossRef] [PubMed] [Google Scholar]
- Vanderstukken M, Mazzeo N, van Colen W, et al. 2011. Biological control of phytoplankton by the subtropical submerged macrophytes Egeria densa and Potamogeton illinoensis: a mesocosm study. Freshw Biol 56: 1837–1849. [CrossRef] [Google Scholar]
- Van Donk E. 2006. Chemical information transfer in freshwater plankton. Ecol Inform 2: 112–120. [Google Scholar]
- Wu XY, Zhang J, Qin BL, et al. 2013. Grazer density-dependent response of induced colony formation of Scenedesmus obliquus to grazing-associated info chemicals. Biochem Syst Ecol 50: 286–292. [CrossRef] [Google Scholar]
- Wu ZB, Deng P, Wu XH, et al. 2007. Allelopathic effects of the submerged macrophyte Potamogeton malaianuson Scenedesmus obiquus. Hydrobiologia 592: 465–474. [CrossRef] [Google Scholar]
- Yang Z, Liu Y, Ge J, et al. 2010. Aggregate formation and polysaccharide content of Chlorella pyrenoidosa Chick (Chlorophyta) in response to simulated nutrient stress. Bioresour Technol 101: 8336–8341. [CrossRef] [PubMed] [Google Scholar]
- Zhao JG, He FF, Chen ZH, et al. 2012. Effect of culture and extract solutions of macrophytes on the growth of three common algae. J Freshw Ecol 27: 367–379. [CrossRef] [Google Scholar]
- Zheng GL, Xu RB, Chang XX, et al. 2013. Cyanobacteria can allelopathically inhibit submerged macrophytes effects of Microcystis aeruginosa extracts and exudates on Potamogeton malaianus. Aquat Bot 109: 1–7. [CrossRef] [Google Scholar]
- Zhu JY, Liu BY, Wang J, et al. 2010. Study on the mechanism of allelopathic influence on cyanobacteria and chlorophytes by submerged macrophyte (Myriophyllum spicatum) and its secretion. Aquat Toxicol 98: 196–203. [CrossRef] [PubMed] [Google Scholar]
- Zhu XX, Nan HH, Chen QW, et al. 2015. Potential grazing intensity directly determines the extent of grazer-induced colony formation in Scenedesmus obliquus. Biochem Syst Ecol 61: 271–277. [CrossRef] [Google Scholar]
- Zhu XX, Wang J, Chen QW, et al. 2016. Costs and trade-offs of grazer-induced defenses in Scenedesmus under deficient resource. Sci Rep-UK 6: 22594. [CrossRef] [Google Scholar]
- Zhu XX, Wang YY, Hou XY, et al. 2019. High temperature promotes the inhibition of Zn2+ on inducible defense of Scenedesmus obliquus. Chemosphere 216: 203–212. [CrossRef] [PubMed] [Google Scholar]
- Zhu XX, Wang ZS, Zhou QM, et al. 2021. Species-specific effects of macrophytes on the anti-grazer morphological defense in Scenedesmus obliquus. Ecol Indic 120: 106942. [CrossRef] [Google Scholar]
- Zuo SP, Fang ZS, Yang SY, et al. 2015. Effects of allelopathic potential from selected aquatic macrophyts on algal interaction in the polluted water. Biochem Syst Ecol 61: 133–138. [CrossRef] [Google Scholar]
Cite this article as: Dai D, Yang Y, Wang F, Zhang Y, Zhang M, Gao Y, Gao X, Dong J, Li X, Chang M. 2023. Allelopathic effects of Egeria densa on the growth and morphology of Chlorella vulgaris. Int. J. Lim. 59: 4:
All Tables
Summary of two-Way ANOVA analysis on the effects of algal density, biomass of E. densa and their interaction on the nutrients (TDN, TDP) in algal cultivation and inhibition on C. vulgaris by E. densa at the end of the experimentation
Repeated measurement analysis of variance comparing algal morphology (Colony proportion and cell number per colony), soluble intracellular polysaccharide and extracellular polysaccharide under gradient initial algal cultivation density and different biomass of E. densa during the experimental period.
All Figures
|
Fig. 1 The content of TDN and TDP in cultivation of C. vulgaris with or without E. densa at the end of the experimentation. |
| In the text | |
|
Fig. 2 Inhibition rate on OD680, algal density and Chla of C. vulgaris induced by E. densa at the end of the experimentation. |
| In the text | |
|
Fig. 3 The average cell number per colony of C. vulgaris with gradient concentration of initial algal cultivation density in the absence or presence of E. densa during the cultivation period. |
| In the text | |
|
Fig. 4 The colony proportion of C. vulgaris with gradient concentration of initial algal cultivation density in the absence or presence of E. densa during the cultivation period. |
| In the text | |
|
Fig. 5 The soluble extracellular polysaccharide in C. vulgaris with gradient concentration of initial algal cultivation density in the absence or presence of E. densa during the cultivation period. |
| In the text | |
|
Fig. 6 The soluble intracellular polysaccharide in C. vulgaris with gradient concentration of initial algal cultivation density in the absence or presence of E. densa during the cultivation period. |
| In the text | |
Current usage metrics show cumulative count of Article Views (full-text article views including HTML views, PDF and ePub downloads, according to the available data) and Abstracts Views on Vision4Press platform.
Data correspond to usage on the plateform after 2015. The current usage metrics is available 48-96 hours after online publication and is updated daily on week days.
Initial download of the metrics may take a while.