Fig. 4
Download original image
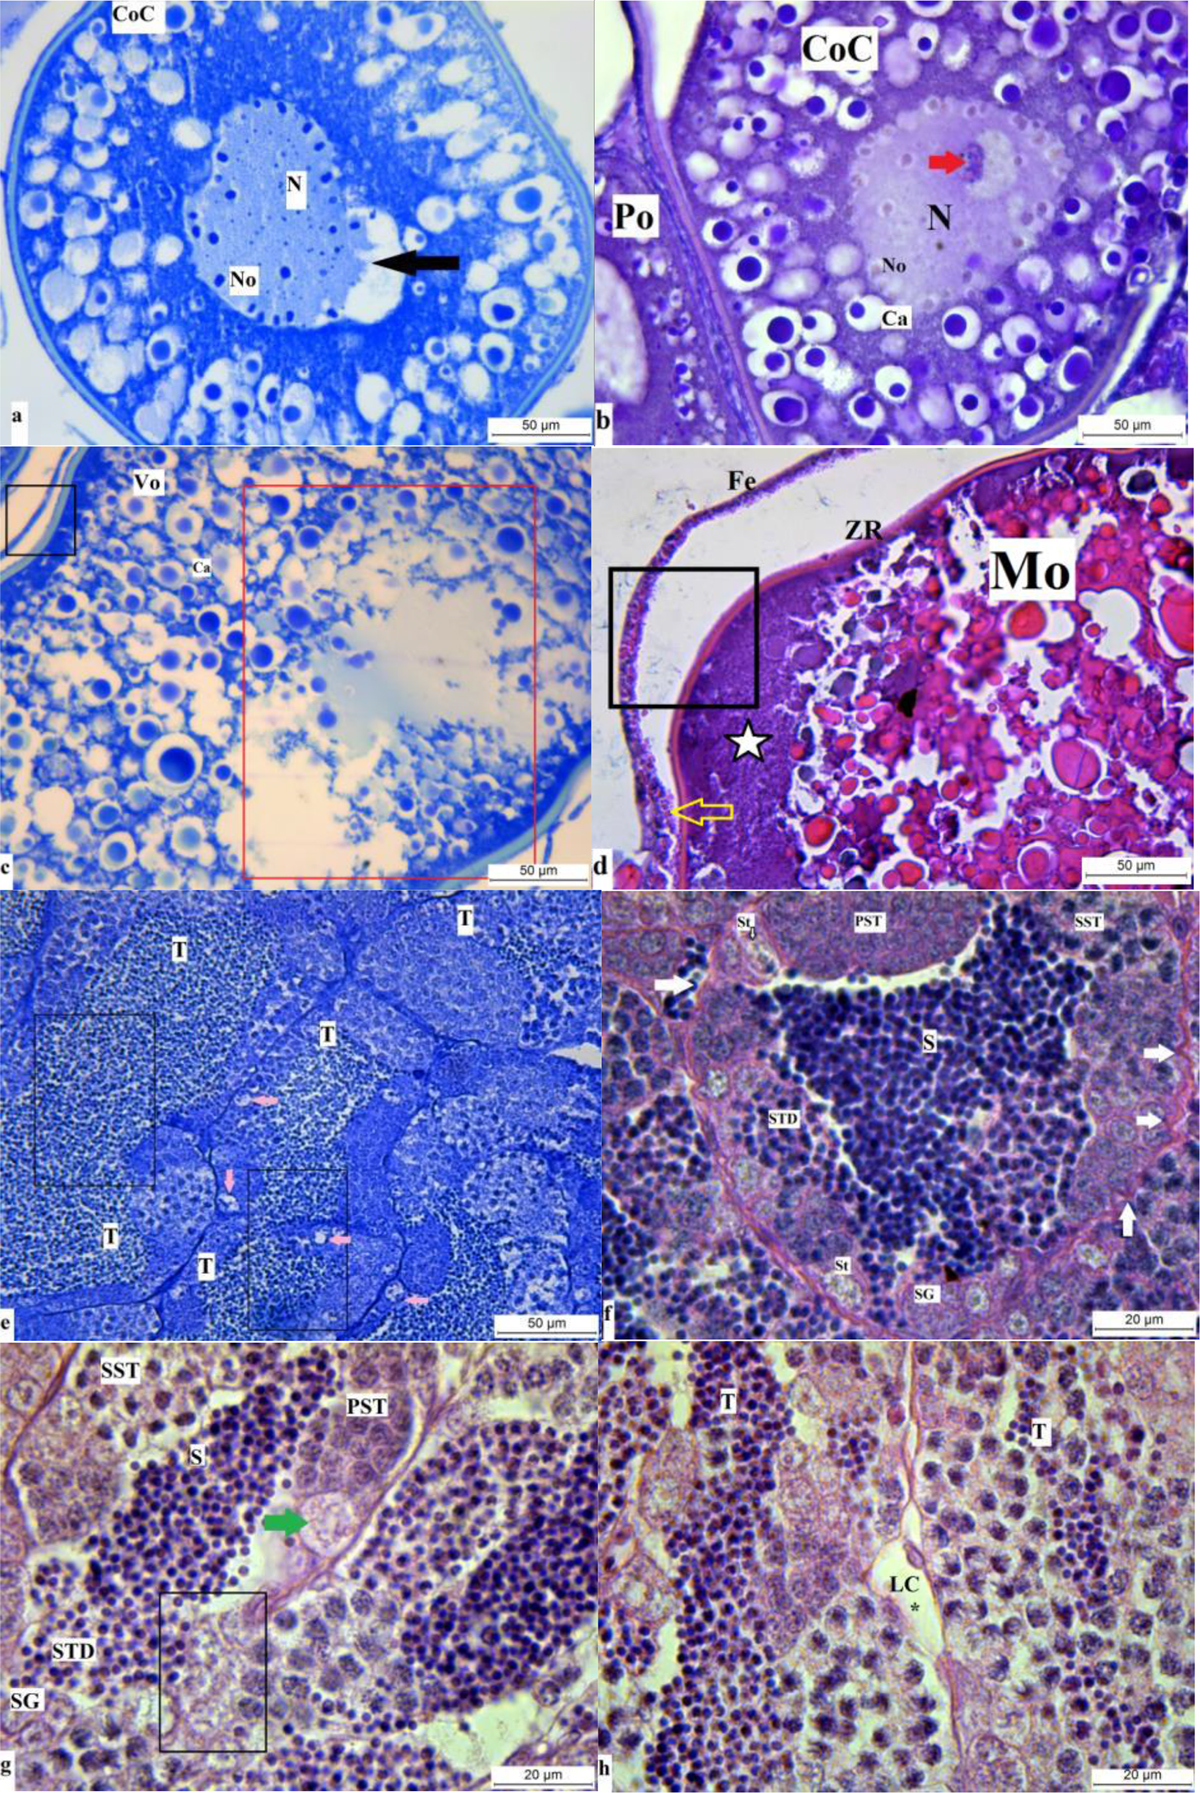
Gonad histology of 38 mg/L of imidacloprid exposed group, a) Karyorrhexis at the nucleus of cortical alveolar stage oocyte, TB stain, b) Disruption of nucleolus organization and formation of nucleolus clusters in the center of the nucleus, PAS stain, c) Vacuolization and unification at cortical alveoli, TB stain, d) Impaired ooplasm at mature oocytes, H&E stain, e) Unification at seminiferous tubules and hypertrophic spermatogonia, TB stain, f) fluctuation at the border of seminiferous tubules, H&E stain, g) Hypertrophy at primary spermatocytes, PAS stain, h) hypertrophy at Leydig cell, PAS stain. Po: Primary oocyte; CoC: Cortical alveolar stage oocyte, Ca: cortical alveoli, Vo: Vitellogenic oocyte, Mo: Mature oocyte, N:nucleus, No: nucleolus, ZR: Zona radiata, Fe: Follicular epithelium, T: seminiferous tubule, SG: spermatogonia, PST: primary spermatocyte, SST: secondary sprmatocyte, STD: spermatid, St: Sertoli cell, LC: Leydig cell, black arrow: karyorrhexis, red arrow: clusters of the nucleolus, red rectangle: vacuolization and unification of cortical alveoli, black square: openings at perifollicular layers, black rectangle: unification of seminiferous tubules, yellow arrow: hyperplasia at perifollicular cells, star: impaired ooplasm, pink arrow: hypertrophy at spermatogonia, white arrow: fluctuations at the border of the seminiferous tubule, green arrow: hypertrophy at primary spermatocyte, asterisks: hypertrophy at Leydig cell.
Current usage metrics show cumulative count of Article Views (full-text article views including HTML views, PDF and ePub downloads, according to the available data) and Abstracts Views on Vision4Press platform.
Data correspond to usage on the plateform after 2015. The current usage metrics is available 48-96 hours after online publication and is updated daily on week days.
Initial download of the metrics may take a while.