Free Access
Fig. 2
Download original image
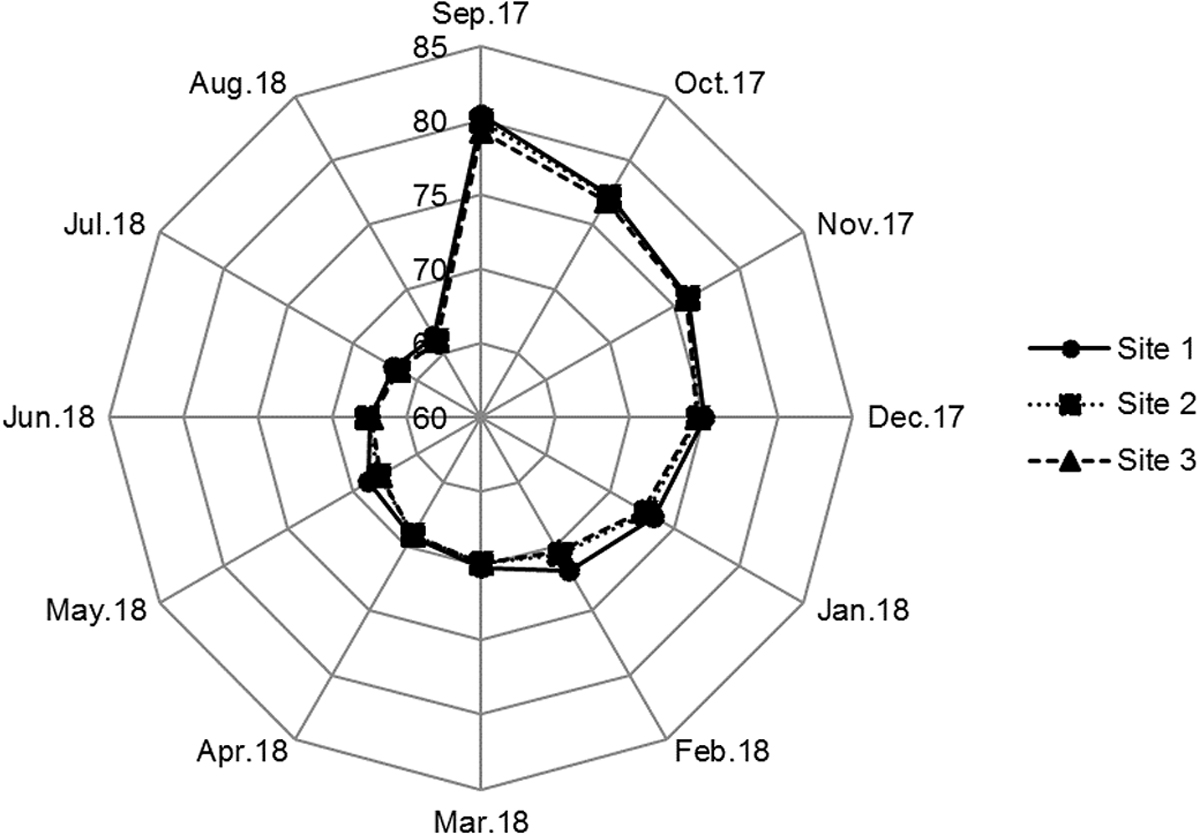
Radar Graph of the trophic state index (TSI) values calculated at different surface water sampling sites in Foum-Gleita Reservoir during the study period from September 2017 to August 2018.
Current usage metrics show cumulative count of Article Views (full-text article views including HTML views, PDF and ePub downloads, according to the available data) and Abstracts Views on Vision4Press platform.
Data correspond to usage on the plateform after 2015. The current usage metrics is available 48-96 hours after online publication and is updated daily on week days.
Initial download of the metrics may take a while.