| Issue |
Ann. Limnol. - Int. J. Lim.
Volume 56, 2020
|
|
|---|---|---|
| Article Number | 16 | |
| Number of page(s) | 14 | |
| DOI | https://doi.org/10.1051/limn/2020014 | |
| Published online | 03 July 2020 | |
Research Article
Quantifying spatiotemporal rhythm of stream metabolism along human disturbance gradients
Department of Environmental Engineering, Bolu Abant Izzet Baysal University, Bolu, 14030 Turkey
* Corresponding author: This email address is being protected from spambots. You need JavaScript enabled to view it.
Received:
8
November
2019
Accepted:
27
May
2020
Abstract
This study aimed at investigating the effects of the urban wastewater treatment plant (WTP) discharges on the metabolism of Büyüksu Stream (Bolu, Turkey), and modelling the metabolism components as a function of measured environmental variables. Dissolved oxygen (DO) and water temperatures (Tw) were measured to estimate montly stream metabolism in the four reaches: Before and after discharges of the WTP, and the headwaters of Abant Creek and Mudurnu Creek feeding Büyüksu Stream. The DO and Tw measurements were performed for 17 months between August 2015 and December 2016. Metabolism components of community respiration (Rc), gross primary production (GPP) and net ecosystem metabolism (NEM) were estimated by using the two-station method. According to naturality gradient (reach disturbance gradients: before and after discharges, and headwaters of the creeks), mean metabolism components were compared by performing the one-way analysis of variance. The comparison results showed that the WTP discharges increased the average Rc from −30.6 g O2 m−2 day−1 to −130.9 g O2 m−2 day−1, and had no significant impact on the average GPP, statistically (15.6 and 9.1 g O2 m−2 day−1 before and after discharges, respectively). Validations of the multiple non-linear regression models of NEM and Rc gave coefficients of determination of 74.9% and 66.6%, respectively.
Key words: Stream metabolism / stream health / diel oxygen technique / two-station method / wastewater
© EDP Sciences, 2020
1 Introduction
Stream metabolism represents the structural and functional characteristics of a stream ecosystem. It is one of the fundamental indicators of nutrient and organic matter cycling and stream health, based on physical, chemical and biological properties of streams (hydrology, geomorphology, climate, water chemistry, aquatic and riparian vegetation, etc.) (Mulholland et al., 2005; Izagirre et al., 2008; Williamson et al., 2008; Bernot et al., 2010). Gross primary production (GPP), net ecosystem metabolism (NEM) and community respiration (Rc) are the main components of stream metabolism. Primary productivity is defined as the rate of which organic matter (biomass) is formed from inorganic carbon by photosynthesizing organisms, thus representing the conversion of solar energy to reduced chemical energy (Bott, 2006).
Diel oxygen techniques (DOTs) have been commonly used to estimate metabolism components in streams, lakes and lagoons and are based on measuring diel variations of dissolved oxygen (DO) concentrations due to photosynthesis, respiration and reaeration in the water bodies (Odum, 1956; Seeley, 1969; Wang et al., 2003; Vallino et al., 2005; Staehr and Sand-Jensen, 2007; Van de Bogert et al., 2007; Ciavatta et al., 2008; Hanson et al., 2008; Staehr et al., 2010; Karakaya et al., 2011). In the related literature, different DOTs such as whole-stream method (also known as open channel diel oxygen method: single or two-station method) and chamber methods have been used to measure the stream metabolism affected by land use (agriculture, forest, etc.), livestock production, groundwater inputs, etc. (Ganning and Wulff, 1970; Grimm and Fisher, 1984; Marzolf et al., 1994; Young and Huryn, 1998; Fellows et al., 2001; Mulholland et al., 2001; Hall and Tank, 2005; Houser et al., 2005; Roberts et al., 2007; Gücker et al., 2009; Bernot et al., 2010; Riley and Dodds, 2013; Yates et al., 2013; Roley et al., 2014; Houser et al., 2015). Effects of wastewater treatment plant (WTP) discharges on stream metabolism are also important as WTPs are prevalent across the world and their discharges are sources of nutrients and organic carbon. There are many studies related to the influence of WTP discharges, such as Kicklighter (1987), Gücker et al. (2006), Ruggiero et al. (2006), Sanchez-Perez et al. (2009), Wassenaar et al. (2010), Chen (2013), Aristi et al. (2015), Chesworth (2016). They concluded that WTP discharges increased Rc while different GPP results were obtained. For example, Gücker et al. (2006) found that GPP increased after the discharges, while Kicklighter (1987) determined as it decreased. Sunlight absorbed by the high density wastewater was indicated as the reason of these different results of GPP in the related literature.
In this regard, the first purpose of this study was to investigate the effects of the urban WTP discharges which consist of both treated and untreated raw sewage on the metabolism of Büyüksu Stream (Bolu, Turkey). The previous studies only focused on the effects of WTP discharges, land use, etc. on stream metabolism by using DOTs and there are no comprehensively model studies between metabolism rates and environmental variables. Thus, the second purpose was to model the metabolism components (GPP, NEM, and Rc) as a function of measured environmental variables including air temperature (Tair), atmospheric pressure (Patm), relative humidity (RH) and water quality variables. Within this first study related to the effects of WTP on the stream metabolism in Turkey, both the results were compared with the previous studies and it was sought to fill the gap in the statistical modelling of metabolism rates.
2 Material and method
2.1 Study site
Büyüksu Stream is located in Bolu Province in the western Black Sea region of Turkey, is fed by the two main tributaries of Abant Creek and Mudurnu Creek, and has a drainage catchment area of 1112.5 km2 (see Fig. 1). The basin of Büyüksu Stream consists of approximately 3.1% residential and urban areas, 28.3% agricultural areas, 0.24% wetlands, and 68.36% forests, prairies, etc. According to the long-term meteorological data between 1927 and 2016, Bolu has a cool temperate climate with snowy winters and warm summers with cool nights. The mean annual temperature is 10.5 °C, the mean annual maximum and minimum temperature are 17.1 °C (max. 39.8 °C) and 4.5 °C (min. −34 °C), respectively. The mean annual precipitation is 545.3 mm, while the mean annual number of days with precipitation is 137.7, and the mean annual sunshine hours are 65.6 h (total of mean daily hours of every month) (Turkish State Meteorological Service, 2017).
Bolu City WTP (Activated Sludge Process) has two separate and continuous discharges, which are treated and untreated, received by Büyüksu Stream. Because the capacity of the WTP is not sufficient to treat all the city's wastewaters (The WTP can only treat 50% of the entire wastewater). The distance between two discharges is approximately 15 m.
Measurements were carried out in the following four reaches: before (BD) and after discharges (AD) of the WTP in Büyüksu Stream, and the springs of Mudurnu Creek and Abant Creek between August 2015 and December 2016. The springs (headwaters) of Mudurnu Creek and Abant Creek were sampled to represent reference conditions for water quality in the basin. Coordinates and locations of four reaches were given in Table 1 and Figure 1, respectively. The springs of Abant Creek and Mudurnu Creek are approximately 41.2 km and 31.4 km away to BD reach, respectively. The distance between BD and AD reaches is 0.5 km, and AD reach is 0.2 km downstream of the WTP discharges.
 |
Fig. 1 Locations of the four reaches in the basin of Büyüksu Stream. |
Geographical informations of each reach and sampling DOYs between August 2015 and December 2016.
2.2 Measurements of environmental variables
Metabolism components were estimated using the two-station method developed by Odum (1956) for 1–6 days in every month between August 2015 and December 2016 (17 months). DO (mg L−1) and water temperature (Tw, °C) measurements were performed at the upstream (US) and downstream (DS) of each stream reach with one-minute intervals (dt = 1 min) for at least 36 hours (2–7 days) by using oxygen data loggers (MiniDOT, PME, Vista, CA, USA). The reach length was selected as 150 m for each study reach, according to Bales and Nardi (2007). The data loggers were placed in protection cages throughout the measurements. While measuring DO and Tw, air temperature (Tair, °C), atmospheric pressure (Patm, bar) and relative humidity (RH, %) were simultaneously measured (dt = 1 min) by using data loggers (RHT50, Extech Instruments, USA).
Water samples were collected at 15-minute intervals during two hours for composite samples (one composite sample consists of 9 water samples mixed) representing average water quality while stream flow rate (Q, m3 s−1), stream velocity (V, m s−1), stream depth (D, m), and stream width (W, m) were measured by using an acoustic doppler velocimeter (SonTek FlowTracker Handheld ADV, California, USA) on the day of both deployment and collection of the DO loggers in each reach and every month. Linear interpolations based on time were applied for Q, V, and D values measured at the start and end of the deployment of the DO loggers instead of average of two measurements for more accurate estimations of GPP, NEM, and Rc.
In the water samples, pH, specific conductivity (SC, µS cm−1), biochemical oxygen demand (BOD5, mg L−1), total nitrogen (TN, mg L−1), total phosphorus (TP, mg L−1), orthophosphate (ortho-PO4-P, mg L−1), ammonium nitrogen (NH4-N, mg L−1), nitrate nitrogen (NO3-N, mg L−1), chlorophyll a (chl-a, µg L−1) and turbidity (NTU) were measured. pH and SC were measured by using a multi-parameter probe (Hach HQ40d portable meter, Hach Company, Loveland, CO, USA). BOD5 was measured by using a respirometric pressure system (WTW Oxitop IS6, Germany). TN was measured by Hach LCK 138 Laton cuvette test (ınorganically and organically bonded nitrogen is oxidized to nitrate by digestion with peroxo-disulphate, the nitrate ions react with 2.6-dimethylphenol in a solution of sulphuric and phosphoric acid to form a nitrophenol). TP was measured by Hach LCK 349 phosphate cuvette test (Phosphate ions react with molybdate and antimony ions in an acidic solution to form an antimonyl phosphomolybdate complex, which is reduced by ascorbic acid to phosphomolybdenum blue). Ortho-PO4-P was measured by using Hach phosphorus reactive powder pillows (ascorbic acid method adapted from APHA, 1999). NH4-N was measured by using Hach nitrogen reactive powder pillows (Salicylate method adapted from Reardon et al., 1966). NO3-N was measured by Hach LCK 339 nitrate cuvette test (Nitrate ions in solutions containing sulphuric and phosphoric acids react with 2.6-dimethylphenol to form 4-nitro-2.6-dimethylphenol). Chl-a was measured by spectrophotometric method (APHA, 1999). DR 5000 UV/VIS spectrophotometer (Hach Lange, Germany) was used in the measurements of TN, TP, ortho-PO4-P, NH4-N, NO3-N, chl-a. Turbidity was measured by using a portable turbidimeter (HF Scientific Micro TPI, Fort Myers, USA). Sampling days of year (DOYs) in the study were given in Table 1.
2.3 Estimations of metabolism components
Metabolism components were calculated by using the following equations (Bales and Nardi, 2007): (1)
(1)
where Fr(t) is the reaeration flux (mg O2 reach−1 min−1) at time t, Davg is the reach-averaged DO deficit (mg L−1) as DOsat (t) (saturated DO concentration) minus DO(t), K2 (Tw) is the reaeration rate coefficient (min−1) at Tw (°C), Q is stream flow rate (L s−1), Tt is travel time (min), and Cf is the unit conversion factor (1 min = 60 s). In this study, K2 at Tw = 20 °C was estimated by using the equation (2) (Owens et al., 1964) because it is suitable for characteristics (depth, velocity, etc.) of the sampled reaches.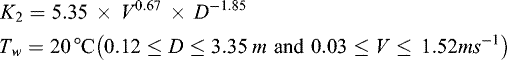 (2)
(2)
K2 at any Tw was calculated by using the following equation by Elmore and West (1961): (3)
(3)
NEM was calculated for each measurement interval (one minute) as follows: (4)
(4)
where NEM(t) is the net metabolism flux (mg O2 reach−1 min−1) at time t, DOd(t) is downstream DO concentration (mg L−1) at time t, DOu(t-Tt) is upstream DO concentration (mg L−1) at time t–Tt. The nighttime NEM was assumed to be equal to Rc as no GPP occurs at night. Daytime Rc (Rd) was estimated using the approach proposed by Mulholland et al. (2001) in which mean respiration rates of one-hour pre-dawn and one-hour post-sunset (dusk) periods were calculated and assumed to be respiration rates at the start and end of daylight, respectively. Then, Rd at each measurement interval during daylight was extrapolated between the start and end rates as follows: (5)where Rd(t) is the daylight respiration flux (mg O2 reach−1 min−1) at given time t, Rpre-dawn is the mean respiration rate (mg O2 reach−1 min−1) calculated from individual net metabolism fluxes for the one-hour period before dawn. Rpost-sunset is the mean respiration rate (mg O2 reach−1 min−1) calculated from individual net metabolism fluxes for the one-hour period following sunset. nd is the total number of measurement intervals during daylight hours including the first and last daylight readings. Ni is the serial number of the daylight measurement interval for calculating Rd(t), with Ni = 1 = 0. A 24-hour total Rc was calculated as g O2 reach−1 day−1 from the two nighttime periods and the daylight period as the following:
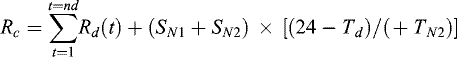 (6)where SN1 is the sum of the net metabolism flux for the first night-time period, SN2 is the sum of the net metabolism flux for the second night-time period, Td is a duration of the daytime period in hours, TN1 is a duration of the first night-time period in hours, TN2 is a duration of the second night-time period in hours. GPP was calculated for each measurement interval (one minute) as follows:
 (7)
(7)
where GPP(t) is gross primary productivity flux (g O2 reach−1 min−1) at time t, Rc(t) is community respiration flux (g O2 reach−1 min−1) at time t. GPP, NEM and Rc estimates were converted to g O2 m−2 day−1 by using surface areas of reaches. The surface area was calculated by multiplying width and length of the reach. Measured DO data were corrected for the issues of sensor fouling and calibration drift during the deployment using the method by Wagner et al. (2006).
2.4 Statistical analyses
All statistical analyses were performed by using Minitab 17.0 software (Minitab Inc. State College, PA, USA). Pearson's correlation matrix among the metabolism rates and the associated environmental variables in each reach was performed to detect the direction and strength of significant linear relationships. With the parametric tests applied in this study, the following diagnostic assumptions were performed: normality test of residuals of regression models through Q–Q plot and Anderson–Darling statistics, homoscedasticity test through plot of residuals versus fitted values, multicollinearity test through variance inflation factor (according to VIF > 40), and autocorrelation test through Durbin–Watson (DW) statistics. Autocorrelation test was applied according to the following decision rules: no autocorrelation when DW ≈2; a strong positive autocorrelation when DW ≈0; and a strong negative autocorrelation when DW ≈4.
A 17-month-entire dataset was randomly split into training and testing subsets. Based on the parameterization (training) dataset, the best-fit multiple non-linear regression (MNLR) models of NEM and Rc (g O2 m−2 day−1) were obtained using the stepwise procedure by which significant predictors were selected from among the environmental variables and their interactions through order 2. Alpha-to-enter and alpha-to-remove values of the stepwise procedure were selected as 0.05. The adjusted coefficient of determination (R 2adj), and prediction coefficient of determination (R 2pred) were used to evaluate the goodness-of-fit and predictive power of the MNLR models, respectively. In order to represent spatiotemporal heterogeneity, DOY and naturality gradient (NG) variables (reaches of Abant, Mudurnu, BD and AD) were forced as the predictors into the models. NG variables were selected as categorical predictors in the models. MNLR models were also validated by using a validation (testing) dataset randomly selected from the entire dataset and apart from the parameterization (training) dataset.
Tukey's multiple comparison tests following one-way analysis of variance (ANOVA) were applied to determine significant mean GPP, NEM, Rc differences along the reach disturbance gradient (NG) by using all data between August 2015 and December 2016. Thus, effects of the WTP discharges on metabolism rates could be determined by comparing the reaches. Also, the mean metabolism components were compared in terms of the seasons (winter, spring, summer, autumn). Significance level (α) was selected as 0.05 for all comparisons.
3 Results
3.1 Linear relationships between the environmental variables and the metabolism rates
According to mean monthly environmental variables and metabolism rates between August 2015 and December 2016, AD reach had a maximum Rc rate with highest values of SC, BOD5, TN, TP, NH4-N, ortho-PO4-P, turbidity and flow rate in each month (see Tab. 2 and Appendix Tab. 1). The averages of NEM rates were negative in each reach for all months except August 2015 and April 2016 in BD reach.
Results of Pearson's correlation matrix applied among the environmental variables and the metabolism rates showed that there was a discrepancy in correlations between the environmental variables and the metabolism rates in four reaches. In each reach, these environmental drivers correlated with metabolism rates differently (negative or positive, low or high) (see Appendix Tabs. 3–6). This indicates that the linear relationships could spatiotemporally change. However, it might be expected that high concentrations of BOD5 (r = 0.349, p = 0.001), NH4-N (r = 0.478, p < 0.001) and turbidity (r = 0.232, p = 0.037) measured in AD reach have positive and negative correlations to Rc and GPP, respectively (BOD5: r = −0.154, p = 0.171; NH4-N: r = −0.228, p = 0.041; turbidity: r = −0.053, p = 0.641) (see Appendix Tab. 6). Because, Rc might be increased by high DO consumption due to the decomposition of organic matter and the oxidation of NH4-N (nitrification) arising from the discharges of the WTP. On the other hand, GPP might be decreased since high concentrations of turbidity and suspended solids absorbed sunlight and restricted a sufficient solar energy for the photosynthesis. Also, high concentration of ortho-PO4-P measured in AD reach has a positive correlation to Rc (r = 0.418, p < 0.001). Ortho-PO4-P and NH4-N are nutrients for heterotrophic microorganisms as well as autotrophs (Kirchman, 1994). It might be a factor for increasing Rc. Similarly, a positive correlation between Tw and Rc (r = 0.563, p < 0.001) indicates that Tw might stimulate the activity of heterotrophic community in AD reach. This case was seen for GPP in Abant and BD reaches as Tw might stimulate the activity of autotrophs (Abant: r = 0.795, p < 0.001; BD: r = 0.221, p = 0.047).
Descriptive statistics of predictors and responses of the MNLR models.
3.2 MNLR modelling of metabolism rates
Descriptive statistics of the predictors and responses used for the MNLR models were given in Table 2. The MNLR models were derived for Rc and NEM as equations (8) and (10), and they were given in Tables 3 and 4, respectively. The best-fit MNLR model of Rc was parameterized with R 2adj of 87.14% and R 2pred of 81.66%. Thus, DOY, NG, Patm, DOY × Tair, DOY × Patm, DOY × BOD5, DOY × SC, RH × BOD5, Tw × BOD5, BOD5 × SC, BOD5 × pH, BOD5 × NH4-N, BOD5 × ortho-PO4-P, Turbidity × SC, Turbidity × pH, Turbidity × Chl-a, Turbidity × NO3-N, pH × NH4-N predictors (independent variables and interactions) could explain 81.66% of Rc.
According to F-value, the most associated with Rc (response) and the significant predictor is the interaction of BOD5 × SC. In terms of VIF values, DOY, NG (except Mudurnu reach), DOY × Patm, DOY × BOD5, DOY × SC, Tw × BOD5, BOD5 × SC, BOD5 × pH, BOD5 × NH4-N, BOD5 × ortho-PO4-P, Turbidity × SC, Turbidity × pH, pH × NH4-N predictors have multicollinearity issues (VIF > 40) (see Tab. 3). Multicollinearity problem is not desirable in terms of the model confidence. However, there is no exact assumption regarding the multicollinearity for MNLR models. DW value (DW = 1.117) of the model indicates that there is no autocorrelation issue.
The Rc model could predict the validation data in the ratio of 66.6% by comparing calculated (measured) and predicted Rc values (R
2 = 66.6%, S = 25.98, p = 0.001, n=172: total number of explanatory variables of Rc MNLR model and measured Rc data for validation).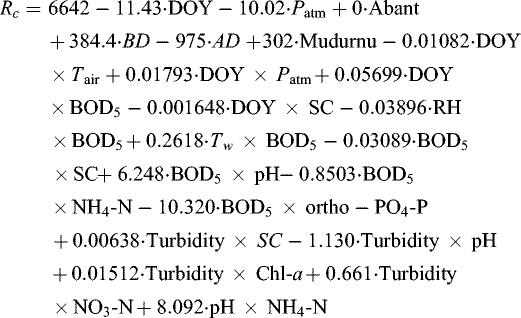 (8)
(8)
The validation equation of Rc is as follows: (9)
(9)
The best-fit MNLR model of NEM was parameterized with R 2adj of 84.6% and R 2pred of 80.04%. DOY, NG, DOY × Tair, DOY × NH4-N, Tair × TP, BOD5 × SC, BOD5 × pH, BOD5 × NH4-N, BOD5 × ortho-PO4-P, TN × Turbidity, TP × Turbidity, Turbidity × pH, SC × NH4-N, NH4-N × NO3-N predictors could explain 80.04% of NEM. The most associated with NEM (response) and the significant predictor is the interaction of DOY × NH4-N.
According to VIF values, DOY × NH4-N, BOD5 × SC, BOD5 × pH, BOD5 × NH4-N, BOD5 × ortho-PO4-P, TN × Turbidity, TP × Turbidity, SC × NH4-N predictors have multicollinearity issues (VIF > 40) (see Tab. 4). DW value (DW = 1.48) of the model indicates that there is no autocorrelation issue.
The NEM model could predict the validation data in the ratio of 74.9% by comparing calculated (measured) and predicted NEM values (R
2 = 74.9%, S = 24.77, p ≤ 0.001, n = 184: total number of explanatory variables of NEM MNLR model and measured NEM data for validation).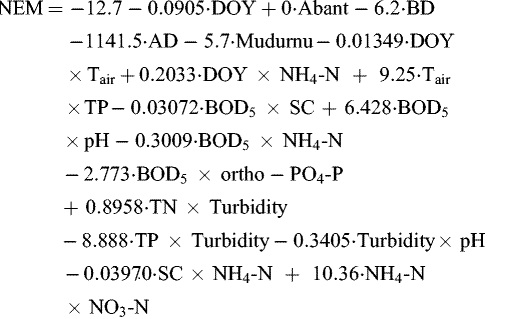 (10)
(10)
The validation equation of NEM is as follows: (11)
(11)
Although high R2adj and R2pred values (87.14% and 81.66%, 84.6% and 80.04% respectively) of Rc and NEM models, low values (10.39%, 7.67%) were obtained for GPP. Instead of using GPP model, GPP estimations were obtained by differences among NEM and Rc predicted from the MNLR models (see Eq. (7)). Calculated (measured) and predicted GPP values were compared for validation with the following equation (R
2 = 54.8%, S = 10.63, p = 0.152, n = 15). (12)
(12)
The best-fit MNLR model of Rc (g O2 m−2 day−1) (R 2adj = 87.14%, R 2pred = 81.66%, S = 54.9, DW = 1.117, α-to-enter and to-remove value for stepwise selection = 0.05, n = 2384).
The best-fit MNLR model of NEM (g O2 m−2 day−1) (R 2adj = 84.6%, R 2pred = 80.04%, S = 60.41, DW = 1.48, α-to-enter and to-remove value for stepwise selection = 0.05, n = 2724).
3.3 One-way ANOVA Tukey's multiple comparisons of GPP, NEM and Rc along the reach disturbance gradient (NG)
Results of the comparisons using all of 17-month-metabolism data between August 2015–December 2016 and mean metabolism rates were given in Table 5 and Figures 2 and 3, respectively. The results showed that there was no significant difference statistically among the group means of GPP in all reaches (GPP group means are A for all reaches). However, according to values of the means, it can be said that discharges of the WTP reduce GPP (GPP before discharges: 15.6 g O2 m−2 day−1, GPP after discharges: 9.1 g O2 m−2 day−1). There was no significant difference among the group means of NEM and Rc in reaches of Abant, Mudurnu, and BD, except AD reach (NEM and Rc group means are A for Abant, Mudurnu and BD reaches; B for AD reach). Rc increased after the discharges of the WTP (Rc before discharge: −30.6 g O2 m−2 day−1, Rc after discharge: −130.9 g O2 m−2 day−1).
Results of the comparisons according to the seasons and mean seasonal metabolism rates were given in Table 6 and Figures 4 and 5, respectively. Comparisons of the mean metabolism components in terms of the seasons enabled the revelation of the following differences (exceptions): In the winter, there was no significant difference statistically among the group means of NEM and Rc in all reaches including AD reach (NEM and Rc group means are A for all reaches), in contrast to the results obtained using all data (see Tables 5 and 6); Although there was not any significant difference among the group means of GPP in BD and AD reaches (GPP group means are A for all reaches), the average of GPP increased after the discharges (GPP before discharge: 2.385 g O2 m−2 day−1, GPP after discharge: 8.72 g O2 m−2 day−1) in the winter; In the summer, there was a significant difference among the group means of Rc in BD and Abant–Mudurnu reaches (see Tab. 6). In the autumn, there was a significant difference among the group means of GPP in BD and AD reaches, and GPP decreased after the discharges (see Tab. 6).
In general, the results showed that Bolu City WTP discharges affected the metabolism of Büyüksu Stream: Rc increased while GPP decreased (although there was no significant GPP difference between BD and AD, statistically) after the discharges.
Tukey's multiple comparisons of metabolism rates (g O2 m−2 day−1) using all data (α = 0.05).
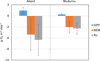 |
Fig. 2 Mean metabolism rates with standard deviations of Abant and Mudurnu reaches according to all data. |
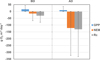 |
Fig. 3 Mean metabolism rates with standard deviations of BD and AD reaches according to all data. |
Tukey's multiple comparisons of metabolism rates (g O2 m−2 day−1) for the seasons (α = 0.05).
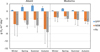 |
Fig. 4 Mean metabolism rates with standard deviations of Abant and Mudurnu reaches according to seasons. |
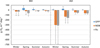 |
Fig. 5 Mean metabolism rates with standard deviations of BD and AD reaches according to seasons. |
4 Discussion
In this study, it was demonstrated whether the statistical models could be derived to predict the metabolism rates in the real environmental conditions (not laboratory conditions). The validation results of the models for NEM and Rc (except GPP) were obtained as high (74.9% and 66.6%, respectively) according to the real conditions. The metabolism rates under different values of the environmental variables in the four reaches can be roughly estimated by using these models.
The study demonstrated that linear relationships among the measured environmental variables and the metabolism rates varied spatiotemporally. It can be said that these environmental variables do not individually explain the metabolism rates since they correlated with the metabolism rates differently in each reach (negative or positive, low or high). Therefore, interactions of the environmental variables were included in the MNLR models. Furthermore, in order to represent this spatiotemporal heterogeneity, DOY and reaches of Abant, Mudurnu, BD and AD were used as explanatory variables (predictors) of the models. In this regard, second-order interactions among the different variables were considered in the MNLR models in addition to individual variables.
Low R 2adj and R 2pred values (10.39%, 7.67%) of GPP model indicated that the environmental variables used as predictors in Rc and NEM models were inadequate to explain GPP statistically. In other words, there is a lot of unexplained variation. Therefore, in addition to the environmental variables used in the study, other variables associated with GPP such as photosynthetically active radiation (PAR), shading percentage (%) (Burrell et al., 2014), etc. should be considered for modelling GPP. Similarly, other variables associated with Rc and NEM such as sediment oxygen demand (SOD) may be used as an individual predictor or may be interacted with the environmental variables in the models to obtain better results.
In general, mean NEM rates were negative in each reach. This indicated that biomass in the reaches decomposed, and generally heterotrophic environment (conditions) was dominant in the four reaches throughout the year. It was found that there was no significant difference between the group means of NEM and Rc in reaches of Abant, Mudurnu, and BD, except AD reach. This indicates that the discharges of the WTP effect NEM and Rc, and according to values of Rc means, the discharges enhance Rc. Rc might be increased since decomposition of high concentrations of organic matter, oxidation of high concentration of NH4-N (nitrification), and heterotrophic microorganisms in discharges of the WTP. Similarly, in the related literature, several researchers such as Gücker et al. (2006), Chen (2013) and Chesworth (2016) found that WTP discharges increased Rc rates. It can be seen that the similarities and differences of mean Rc and GPP among this study and previous studies in Table 7. As it is seen, the mean Rc of this study (−130.9 g O2 m−2 day−1) is greater than the other studies. Dense untreated wastewater discharges might cause this difference (mean BOD5 = 79.6 mg L−1, mean NH4-N = 15.7 mg L−1 in the water after discharges). Gücker et al. (2006) reported mean BOD5 = 7–9 mg L−1 and mean NH4-N = 0.13–0.16 mg L−1 in the downstreams of the discharges (a second greatest mean Rc in Tab. 7). In the summer, high Tair and Tw values might accelerate the growth and activity of the heterotrophic community in the water depending on the sites (In the summer, mean daily Tair and Tw: 19.0–21.3 °C, 20.2–15.4 °C, 21.1–20.0 °C for Abant, Mudurnu and BD-AD reaches, respectively). Thus, the means of Rc might differ significantly in BD and Abant − Mudurnu reaches (see Tab. 6).
It was found that there is a decrease (not significant statistically) in mean GPP after the WTP discharges. This decrease might be because the photosynthesis could not occur while the sunlight was absorbed by the untreated discharges which contain high concentrations of turbidity and suspended solids as well as treated discharges of the WTP. This reason is supported by Kicklighter (1987) who indicated that GPP was decreased because of the dark colour of the wastewater. In contrast, Gücker et al. (2006) found that discharges of treated wastewater containing nutrients (NH4-N, NO3-N, ortho-PO4-P) stimulated GPP rates. But in this study, although there were high concentrations of nutrients in the discharges, the influence of the nutrients on the growth rate of photosynthesizing organisms might be restrained by the untreated wastewaters (due to light deficiency as noted above). Aristi et al. (2015) agreed with this assumption by demonstrating that the increase in the nutrient loads could not affect GPP in the reaches where sunlight was restricted. In the winter, mean GPP increased after the discharges. This might be since a negative effect of the WTP untreated discharges on the transmittance of sunlight was decreased by the dilution through high stream flow rates with precipitations in the winter. High ranges of the metabolism rates in BD and AD were measured due to extreme flow rates with the precipitations in the winter and spring (see Appendix Tab. 1, Fig. 5). Because, the metabolism calculations were also based on stream hydraulics. Moreover, unmeasured contaminants by runoff might disturb the metabolism rates. These high variabilities might result in that some statistical differences between the reaches were not significant.
A comparison of WTP-impacted metabolism components (GPP and Rc) reported by the present study and related studies.
5 Conclusion
With this study, the effects of the WTP discharges on metabolism rates were investigated. The results demostrated that (1) the effects on Rc were greater than GPP, (2) Rc was increased by the discharges, (3) GPP was reduced (except the winter) although there was no significant GPP difference between BD and AD, statistically. Moreover, the linear relationships among the environmental variables measured and the metabolism rates might vary spatiotemporally (in each reach). NEM and Rc rates as a function of measured environmental variables could be spatiotemporally modelled by including DOY and NG (R 2 of 74.9% and 66.6% of model validation, respectively).
Stream hydraulics (stream flow rate, velocity, depth, width) were effective in estimations of the metabolism components. In this study, one-min-interval linear interpolations based on time were applied for Q, V, and D measured at the start and end of the deployment of the DO loggers instead of average (two measurements) for more accurate estimations of GPP, NEM, and Rc. However, it's recommended that simultaneously DO − Tw and Q–V–D measurements should be performed at each measurement interval as much as possible instead of average or linear interpolations. Also, experiences obtained from in-situ measurements in the study suggest that DO probes (data loggers) should not be left in the stream for more than two days because fouling could affect DO readings. In future studies, uncertainty analysis (such as Monte Carlo) can be carried out for MNLR models derived in this study.
WTPs are widespread around the world. Findings of the study prove that the WTP discharges increase the mean Rc. It causes decreases in DO concentration in the water. Thus, aquatic ecosystem and life can be endangered. Even though it was found that the discharges have no impact on the mean GPP as much as Rc in the study, GPP may be increased by the nutrients where turbidity is low and sunlight is sufficient. This may result in eutrophication. In this regard, metabolism rates can be used to show water quality of the streams, and they should be considered in the discharge standards of the WTPs for the receiving water bodies (river, lake, etc.).
Supplementary Material
Supplementary Tables S1 to S6. Access Supplementary Material
Acknowledgments
This study was financially supported by the Scientific Research Projects Unit of Bolu Abant Izzet Baysal University (Grant No: BAP–2015.09.02.851). We are grateful to H. Fidan and E. Özalp for their help with field campaigns.
References
- American Public Health Association (APHA) (1999) Standard Methods for the Examination of Water and Wastewater. [Google Scholar]
- Aristi I, Schiller DV, Arroita M, Barcelo D, Ponsati L, Garcia-Galan MJ, Sabater S, Elosegi A, Acuna V. 2015. Mixed effects of effluents from a wastewater treatment plant on river ecosystem metabolism: subsidy or stress? Freshw Biol 60: 1398–1410. [Google Scholar]
- Bales JD, Nardi MR. 2007. Automated Routines for Calculating Whole-Stream Metabolism–Theoretical Background and User's Guide: U.S. Geological Survey Techniques and Methods 4–C2, 33, Reston, Virginia (online at http://pubs.water.usgs.gov/tm4c2/) [Google Scholar]
- Bernot MJ, Sobota DJ, Hall RO, Mulholland PJ, Dodds WK, Webster JR, Tank JL, Ashkenas LR, Cooper LW, Dahm CN, Gregory SV, Grimm NB, Hamilton SK, Johnson SL, McDowell WH, Meyer JL, Peterson B, Poole GC, Valett HM, Arango C, Beaulieu JJ, Burgin AJ, Crenshaw C, Helton AM, Johnson L, Merriam J, Niederlehner BR, O'Brien JM, Potter JD, Sheibley RW, Thomas SM, Wilson K. 2010. Inter-regional comparison of land-use effects on stream metabolism. Freshw Biol 55: 1874–1890. [Google Scholar]
- Bott TL. 2006. Primary productivity and community respiration, in Hauer FR, Lamberti GA (Eds.), Methods in Stream Ecology. San Diego: Academic Press Inc., pp. 533– 556. [Google Scholar]
- Ciavatta S, Pastres R, Badetti C, Ferrari G, Beck MB. 2008. Estimation of phytoplanktonic production and system respiration from data collected by a real-time monitoring network in the lagoon of venice. Ecol Model 212: 28–36. [CrossRef] [Google Scholar]
- Chen G. 2013. Ecosystem Oxygen Metabolism in an Impacted Temperate River Network: Application of the δ18O-DO Approach, PhD Thesis, Waterloo University, Waterloo. [Google Scholar]
- Chesworth CT. 2016. Lagoon Wastewater Effluent Impacts Stream Metabolism in Red River Tributaries, MSc Thesis, Western Ontario University, London. [Google Scholar]
- Elmore HL, West WF. 1961. Effect of water temperature on stream reaeration. J Sanitary Eng Div 87: 59–71. [Google Scholar]
- Fellows CS, Valett HM, Dahm CN. 2001. Whole-stream metabolism in two montane streams: contribution of the hyporheic zone. Limnol Oceanogr 46: 523–531. [Google Scholar]
- Ganning B, Wulff F. 1970. Measurements of community metabolism in some baltic brackish water rockpools by means of diel oxygen curves. Oikos 21: 292–298. [Google Scholar]
- Grimm NB, Fisher SG. 1984. Exchange between ınterstitial and surface water: ımplications for stream metabolism and nutrient cycling. Hydrobiologia 111: 219–228. [Google Scholar]
- Gücker B, Brauns M, Pusch MT. 2006. Effects of wastewater treatment plant discharge on ecosystem structure and function of lowland streams. J North Am Bentholog Soc 25: 313–329. [CrossRef] [Google Scholar]
- Gücker B, Boechat IG, Giani A. 2009. Impacts of agricultural land use on ecosystem structure and whole-stream metabolism of tropical cerrado streams. Freshw Biol 54: 2069–2085. [Google Scholar]
- Hall RO, Tank JL. 2005. Correcting whole-stream estimates of metabolism for groundwater input. Limnol Oceanogr 3: 222–229. [Google Scholar]
- Hanson PC, Carpenter SR, Kimura N, Wu C, Cornelius SP, Kratz TK. 2008. Evaluation of metabolism models for free-water dissolved oxygen methods in lakes. Limnol Oceanogr Methods 6: 454–465. [Google Scholar]
- Houser JN, Mulholland PJ, Maloney KO. 2005. Catchment disturbance and stream metabolism: patterns in ecosystem respiration and gross primary production along a gradient of upland soil and vegetation disturbance. J North Am Bentholog Soc 24: 538–552. [CrossRef] [Google Scholar]
- Houser JN, Bartsch LA, Richardson WB, Rogala JT, Sullivan JF. 2015. Ecosystem metabolism and nutrient dynamics in the main channel and backwaters of the upper mississippi river. Freshw Biol 60: 1863–1879. [Google Scholar]
- Izagirre O, Agirre U, Bermejo M, Pozo J, Elosegi A. 2008. Environmental controls of whole-stream metabolism ıdentified from continuous monitoring of basque streams. J North Am Bentholog Soc 27: 252–268. [CrossRef] [Google Scholar]
- Karakaya N, Evrendilek F, Güngör K. 2011. Modeling and validating long-term dynamics of diel dissolved oxygen with particular reference to pH in a temperate shallow lake (Turkey). Clean–Soil Air Water 39: 966–971. [CrossRef] [Google Scholar]
- Kicklighter DW. 1987. Effects of Kraft Mill Effluent on Riffle Community Metabolism in a Large River, MSc Thesis, Montana University, Missoula. [Google Scholar]
- Kirchman DL. 1994. The uptake of ınorganic nutrients by heterotrophic bacteria. Microb Ecol 28: 255–271. [Google Scholar]
- Marzolf ER, Mulholland PJ, Steinman AD. 1994. Improvements to the diurnal upstream-downstream dissolved oxygen change technique for determining whole-stream metabolism in small streams. Can J Fish Aquat Sci 51: 1591–1599. [Google Scholar]
- Mulholland PJ, Fellows CS, Tank JL, Grimm NB, Webster JR, Hamilton SK, Marti E, Ashkenas L, Bowden WB, Dodds WK, McDowell WH, Paul MJ, Peterson BJ. 2001. Inter-biome comparison of factors controlling stream metabolism. Freshw Biol 46: 1503–1517. [Google Scholar]
- Mulholland PJ, Houser JN, Maloney KO. 2005. Stream diurnal dissolved oxygen profiles as ındicators of in stream metabolism and disturbance effects: fort benning as a case study. Ecol Indic 5: 243–252. [Google Scholar]
- Odum HT. 1956. Primary production in flowing waters. Limnol Oceanogr 1: 102–117. [Google Scholar]
- Owens M, Edwards RW, Gibbs JW. 1964. Some reaeration studies in streams. Int J Air Water Pollution 8: 469–486. [Google Scholar]
- Reardon J, Foreman JA, Searcy RL. 1966. New reactants for the colorimetric determination of ammonia. Clin Chim Acta 14: 403–405. [Google Scholar]
- Riley AJ, Dodds WK. 2013. Whole-stream metabolism: strategies for measuring and modeling diel trends of dissolved oxygen. Freshw Sci 32: 56–69. [Google Scholar]
- Roberts BJ, Mulholland PJ, Hill WR. 2007. Multiple scales of temporal variability in ecosystem metabolism rates: results from 2 years of continuous monitoring in a forested headwater stream. Ecosystems 10: 588–606. [Google Scholar]
- Roley SS, Tank JL, Griffiths NA, Hall RO, Davis RT. 2014. The influence of floodplain restoration on whole-stream metabolism in an agricultural stream: insights from a 5-year continuous data set. Freshw Sci 33: 1043–1059. [Google Scholar]
- Ruggiero A, Solimini AG, Carchini G. 2006. Effects of a waste water treatment plant on organic matter dynamics and ecosystem functioning in a mediterranean stream. Ann Limnolog Int J Limnol 42: 97–107. [CrossRef] [Google Scholar]
- Sanchez-Perez JM, Gerino M, Sauvage S, Dumas P, Maneux E, Julien F, Winterton P, Vervier P. 2009. Effects of wastewater treatment plant pollution on ın-stream ecosystems functions in an agricultural watershed. Ann Limnolog Int J Limnol 45: 79–92. [CrossRef] [Google Scholar]
- Seeley CM. 1969. The diurnal curve in estimates of primary production. Chesap Sci 10: 322–326. [CrossRef] [Google Scholar]
- Staehr PA, Sand-Jensen K. 2007. Temporal dynamics and regulation of lake metabolism. Limnol Oceanogr 52: 108–120. [Google Scholar]
- Staehr PA, Bade D, Van de Bogert MC, Koch GR, Williamson C, Hanson P, Cole JJ, Kratz T. 2010. Lake metabolism and the diel oxygen technique: state of the science. Limnol Oceanogr Methods 8: 628–644. [Google Scholar]
- Turkish State Meteorological Service, Official Statistics, www.mgm.gov.tr, 20th September 2017. [Google Scholar]
- Vallino JJ, Hopkinson CS, Garritt RH. 2005. Estimating estuarine gross production, community respiration and net ecosystem production: a nonlinear ınverse technique. Ecol Model 187: 281–296. [CrossRef] [Google Scholar]
- Van de Bogert MC, Carpenter SR, Cole JJ, Pace ML. 2007. Assessing pelagic and benthic metabolism using free water measurements. Limnol Oceanogr Methods 5: 145–155. [Google Scholar]
- Wagner RJ, Boulger RW Jr, Oblinger CJ, Smith BA. 2006. Guidelines and Standard Procedures for Continuous Water-Quality Monitors: Station Operation, Record Computation, and Data Reporting: U.S. Geological Survey Techniques and Methods Report 1-D3, U.S. Geological Survey Enterprise Publising Network, Reston, Virginia. [Google Scholar]
- Wang H, Hondzo M, Xu C, Poole V, Spacie A. 2003. Dissolved oxygen dynamics of streams draining an urbanized and an agricultural catchment. Ecol Model 160: 145–161. [CrossRef] [Google Scholar]
- Wassenaar LI, Venkiteswaran JJ, Schiff SL, Koehler G. 2010. Aquatic community metabolism response to municipal effluent ınputs in rivers quantified using diel δ18O values of dissolved oxygen. Can J Fish Aquat Sci 67: 1232–1246. [Google Scholar]
- Williamson CE, Dodds W, Kratz TK, Palmer M. 2008. Lakes and streams as sentinels of environmental change in terrestrial and atmospheric processes. Front Ecol Environ 6: 247–254. [Google Scholar]
- Yates AG, Brua RB, Culp JM, Chambers PA. 2013. Multi-scaled drivers of rural prairie stream metabolism along human activity gradients. Freshw Biol 58: 675–689. [Google Scholar]
- Young RG, Huryn AD. 1998. Effects of land use on stream metabolism and organic matter turnover. Ecol Appl 9: 1359–1376. [Google Scholar]
Cite this article as: Eryiğit M, Evrendilek F, Karakaya N. 2020. Quantifying spatiotemporal rhythm of stream metabolism along human disturbance gradients. Ann. Limnol. - Int. J. Lim. 56: 16
All Tables
Geographical informations of each reach and sampling DOYs between August 2015 and December 2016.
The best-fit MNLR model of Rc (g O2 m−2 day−1) (R 2adj = 87.14%, R 2pred = 81.66%, S = 54.9, DW = 1.117, α-to-enter and to-remove value for stepwise selection = 0.05, n = 2384).
The best-fit MNLR model of NEM (g O2 m−2 day−1) (R 2adj = 84.6%, R 2pred = 80.04%, S = 60.41, DW = 1.48, α-to-enter and to-remove value for stepwise selection = 0.05, n = 2724).
Tukey's multiple comparisons of metabolism rates (g O2 m−2 day−1) using all data (α = 0.05).
Tukey's multiple comparisons of metabolism rates (g O2 m−2 day−1) for the seasons (α = 0.05).
A comparison of WTP-impacted metabolism components (GPP and Rc) reported by the present study and related studies.
All Figures
|
Fig. 1 Locations of the four reaches in the basin of Büyüksu Stream. |
| In the text | |
|
Fig. 2 Mean metabolism rates with standard deviations of Abant and Mudurnu reaches according to all data. |
| In the text | |
|
Fig. 3 Mean metabolism rates with standard deviations of BD and AD reaches according to all data. |
| In the text | |
|
Fig. 4 Mean metabolism rates with standard deviations of Abant and Mudurnu reaches according to seasons. |
| In the text | |
|
Fig. 5 Mean metabolism rates with standard deviations of BD and AD reaches according to seasons. |
| In the text | |
Current usage metrics show cumulative count of Article Views (full-text article views including HTML views, PDF and ePub downloads, according to the available data) and Abstracts Views on Vision4Press platform.
Data correspond to usage on the plateform after 2015. The current usage metrics is available 48-96 hours after online publication and is updated daily on week days.
Initial download of the metrics may take a while.