Fig. 3
Download original image
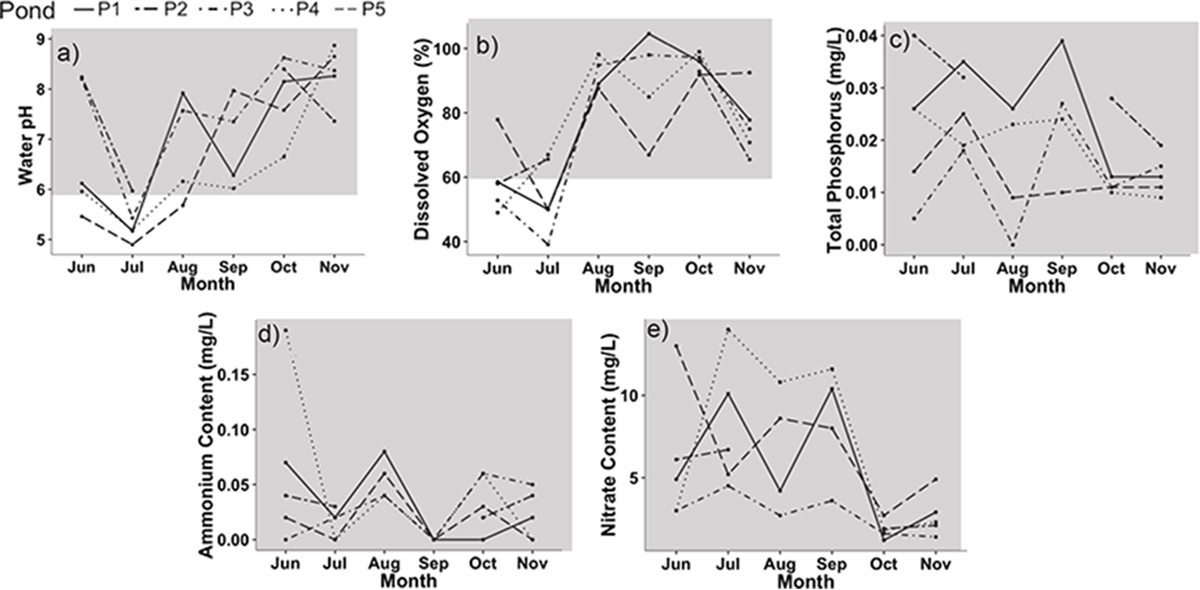
Line graphs representing the evolution of a) pH; b) dissolved oxygen (%); c) ammonium (mg/L); d) nitrates (mg/L) and e) total phosphorus (mg/L) content for each sampling month. The lines represent the studied ponds. The grey limit represents range values for Good Ecological Potential: 6 ≤ pH ≤ 9; 60% ≤ O2% ≤ 120%; TP ≤ 0.13 mg/L ; NH4 + ≤ 1 mg/L; NO3 − ≤ 25 mg/L.
Current usage metrics show cumulative count of Article Views (full-text article views including HTML views, PDF and ePub downloads, according to the available data) and Abstracts Views on Vision4Press platform.
Data correspond to usage on the plateform after 2015. The current usage metrics is available 48-96 hours after online publication and is updated daily on week days.
Initial download of the metrics may take a while.