Fig. 6
Download original image
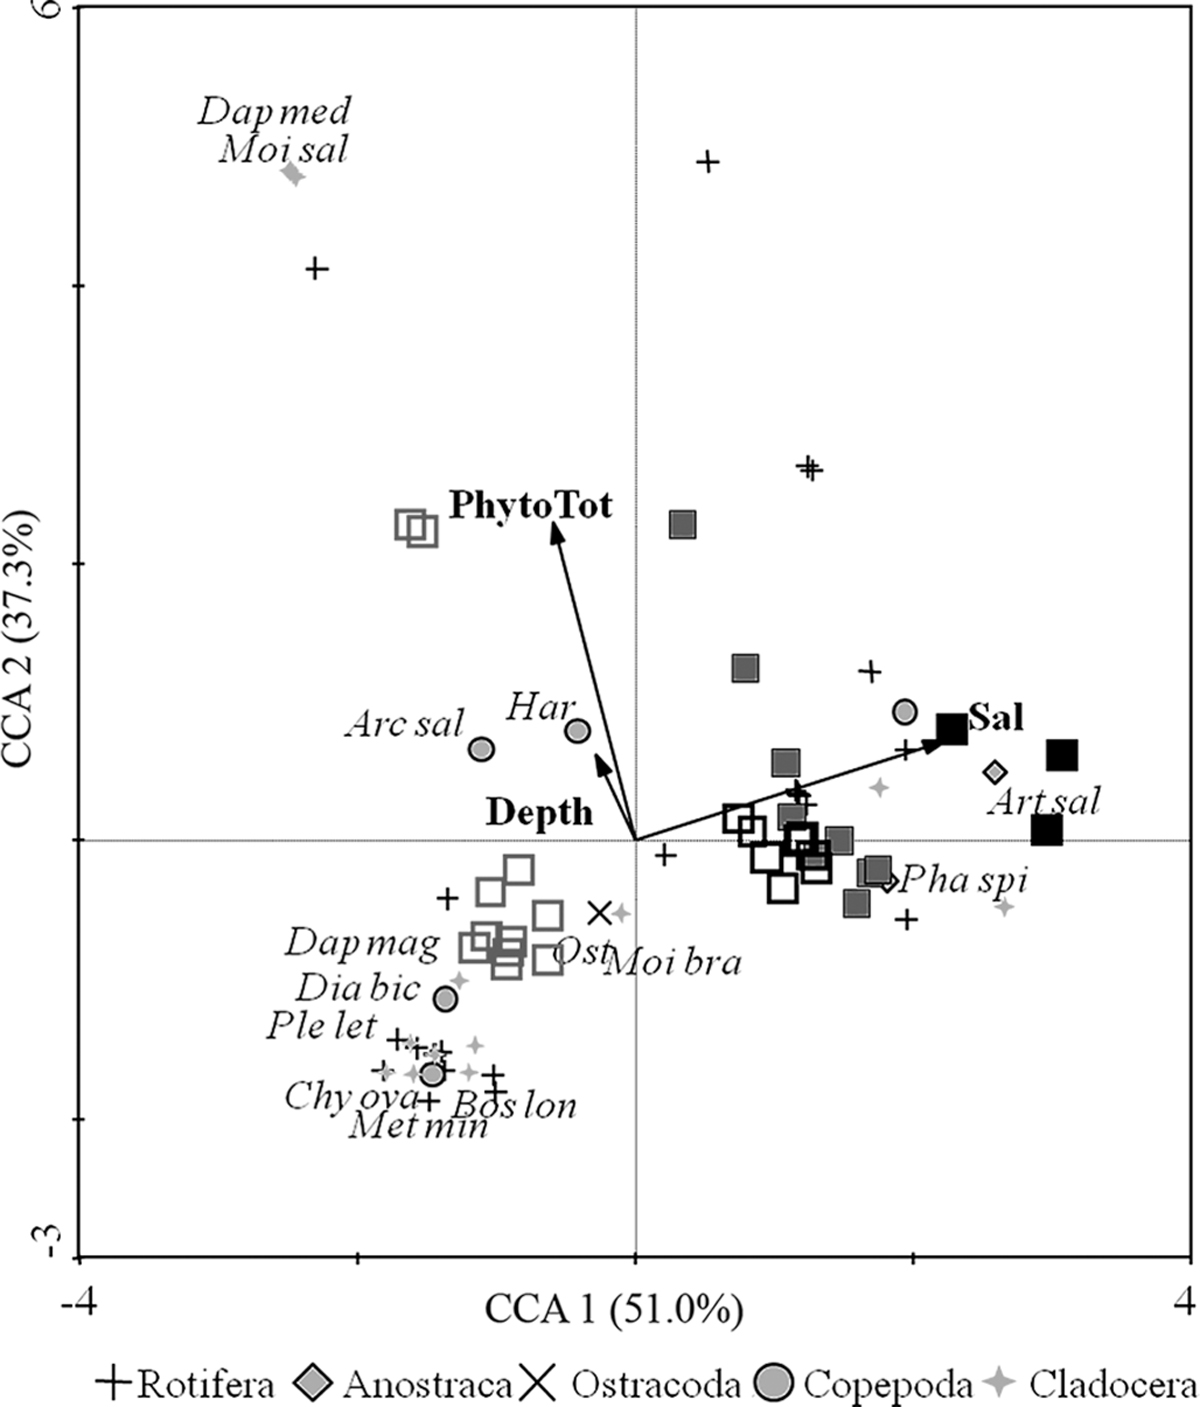
Triplot diagram of zooplankton species, explanatory variables and samples in a canonical correspondence analysis (CCA) of the first and second canonical axis illustrating the relationships among communities in the studied lakes in Cyprus. Square points indicate the position of zooplankton communities in relation to environmental parameters (solid arrows) and species composition (data points) based on taxa's biomass. Samplings were coded based on salinity categories same as in Figure 4b. Labelled taxa indicate the taxa that contributed in similarity and dissimilarity among samplings according to SIMPER analysis (Supplementary Tab. S2); Artemia salina (Art sal), Arctodiaptomus salinus (Arc sal), Bosmina longirostris (Bos lon), Chydorus ovalis (Chy ova), Daphnia magna (Dap mag), Daphnia mediterranea (Dap med), Diacyclops bicuspidatus odessanus (Dia bic), Unidentified harpacticoids (Har), Metacyclops minutus minutus (Met min), Moina brachiata (Moi bra), Moina salina (Moi sal), unidentified ostracods (Ost), Phallocryptus spinosus (Pha spi), Pleuroxus letourneuxi (Ple let).
Current usage metrics show cumulative count of Article Views (full-text article views including HTML views, PDF and ePub downloads, according to the available data) and Abstracts Views on Vision4Press platform.
Data correspond to usage on the plateform after 2015. The current usage metrics is available 48-96 hours after online publication and is updated daily on week days.
Initial download of the metrics may take a while.