Fig. 4
Download original image
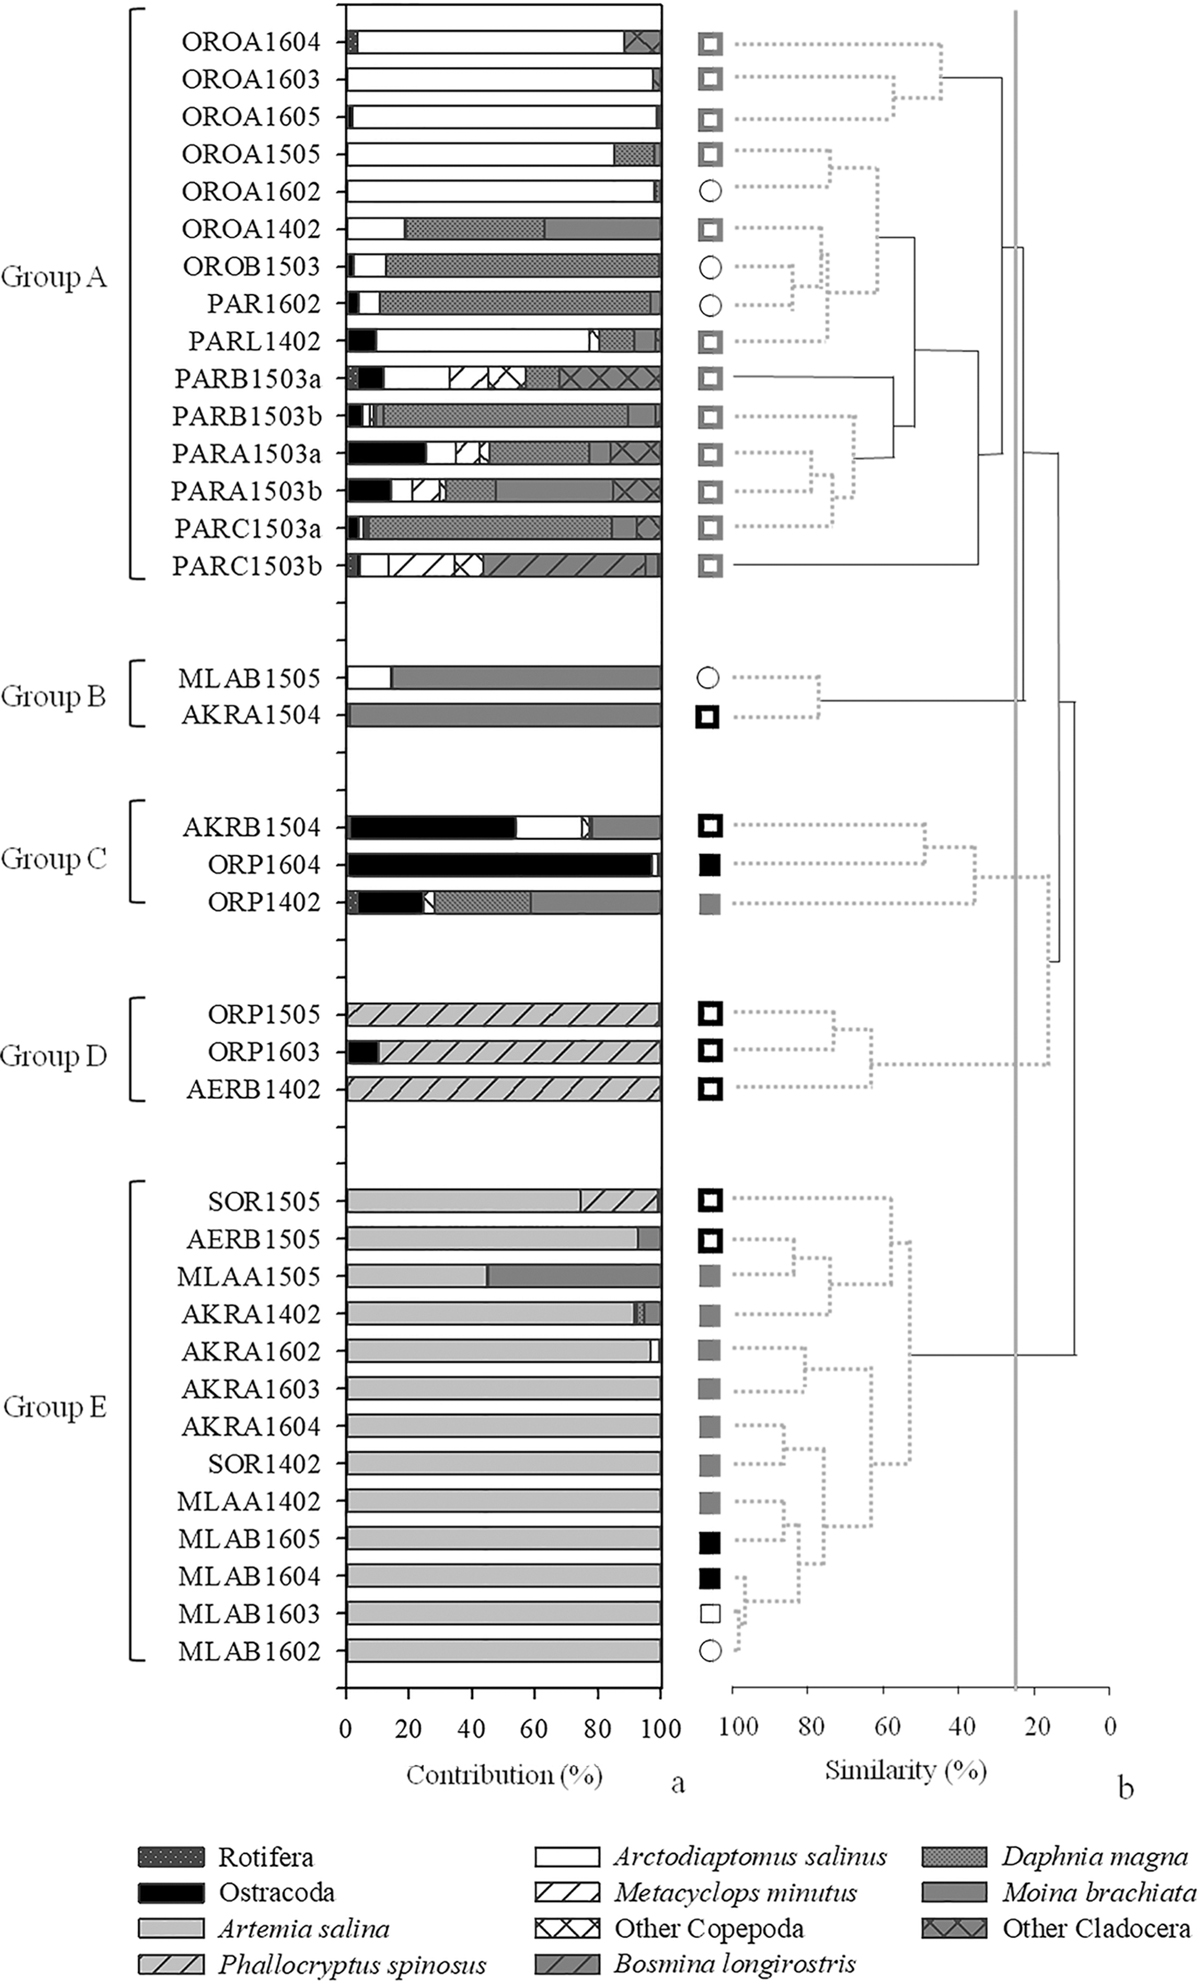
(a) Percentage contribution of dominant zooplankton taxa to total biomass in the studied lakes in Cyprus. (b) Dendogram of Bray-Curtis similarity index of zooplankton community among samplings in the studied lakes of Cyprus from hierarchical agglomerative cluster analysis in log x + 1 transformed data of zooplankton taxa's biomass at level of similarity 25%, as indicated by the solid gray line. Solid black lines indicate significant branches based on SIMPROF permutation tests, while dashed gray lines indicate non-significant divisions. Symbols coded for salinity category open gray square for hyposaline (0–10 ppt), open black square for mesosaline (30–50 ppt), gray filled square for slightly hypersaline (50–70 ppt) and black filled square for strongly hypersaline (>70 ppt) conditions. Samplings abbreviations as shown in Table 1.
Current usage metrics show cumulative count of Article Views (full-text article views including HTML views, PDF and ePub downloads, according to the available data) and Abstracts Views on Vision4Press platform.
Data correspond to usage on the plateform after 2015. The current usage metrics is available 48-96 hours after online publication and is updated daily on week days.
Initial download of the metrics may take a while.