Free Access
Fig. 2
Download original image
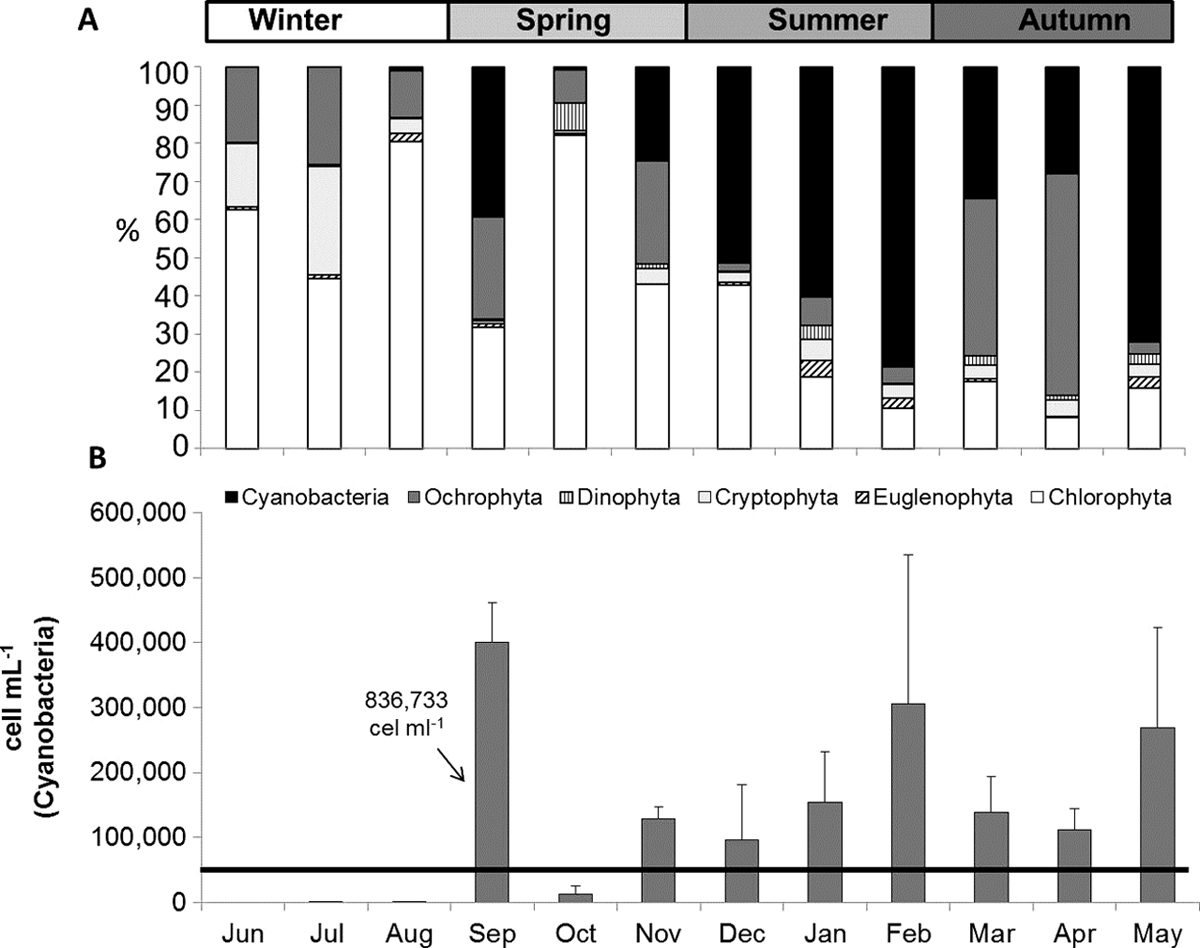
Relative phytoplankton community composition (A) and absolute (cells mL−1) abundance of total cyanobacteria species (vertical lines indicate standard deviation) throughout the study period (the horizontal line denotes the threshold of >50 000 cell mL−1 used in the study to consider a cyanobacteria bloom) (B).
Current usage metrics show cumulative count of Article Views (full-text article views including HTML views, PDF and ePub downloads, according to the available data) and Abstracts Views on Vision4Press platform.
Data correspond to usage on the plateform after 2015. The current usage metrics is available 48-96 hours after online publication and is updated daily on week days.
Initial download of the metrics may take a while.