Fig. 3
Download original image
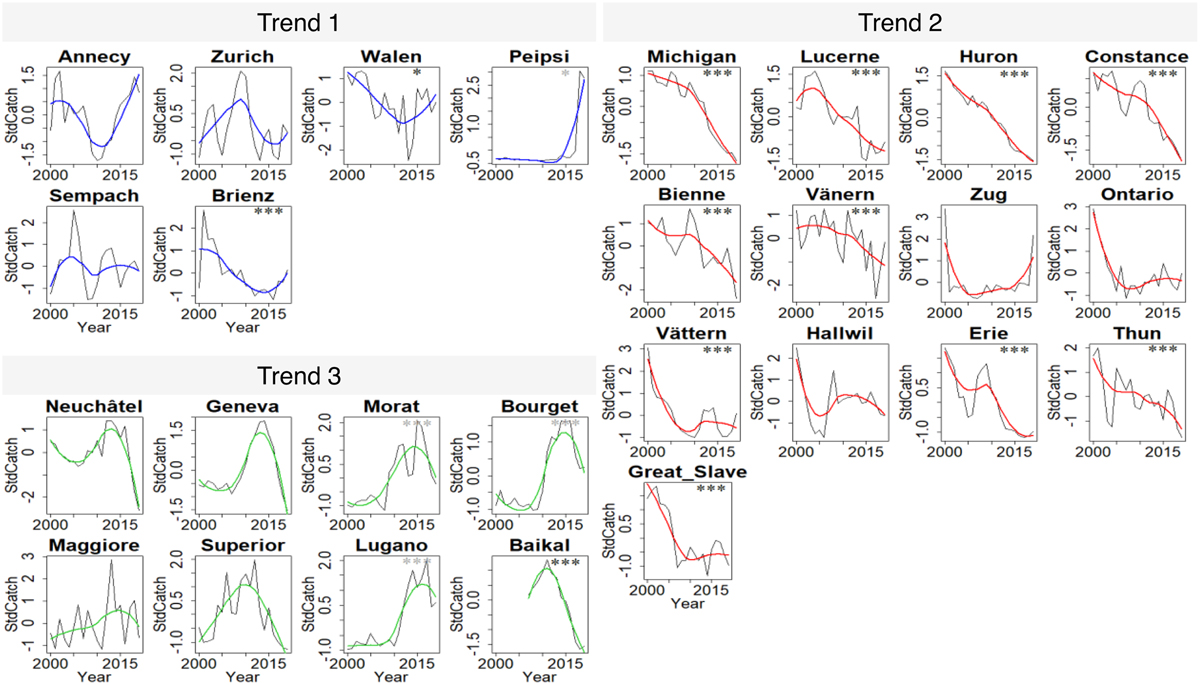
Standardized catches and loess (80% smoothing pan). Trend 1, 2 and 3 represent the three patterns identified by the Dynamic Factor Analysis. Significant trends are indicated by *** (p-value<0.05), * (p-value<0.1). Blacks and grey asterisks indicate negative and positive Sen's slope respectively.
Current usage metrics show cumulative count of Article Views (full-text article views including HTML views, PDF and ePub downloads, according to the available data) and Abstracts Views on Vision4Press platform.
Data correspond to usage on the plateform after 2015. The current usage metrics is available 48-96 hours after online publication and is updated daily on week days.
Initial download of the metrics may take a while.