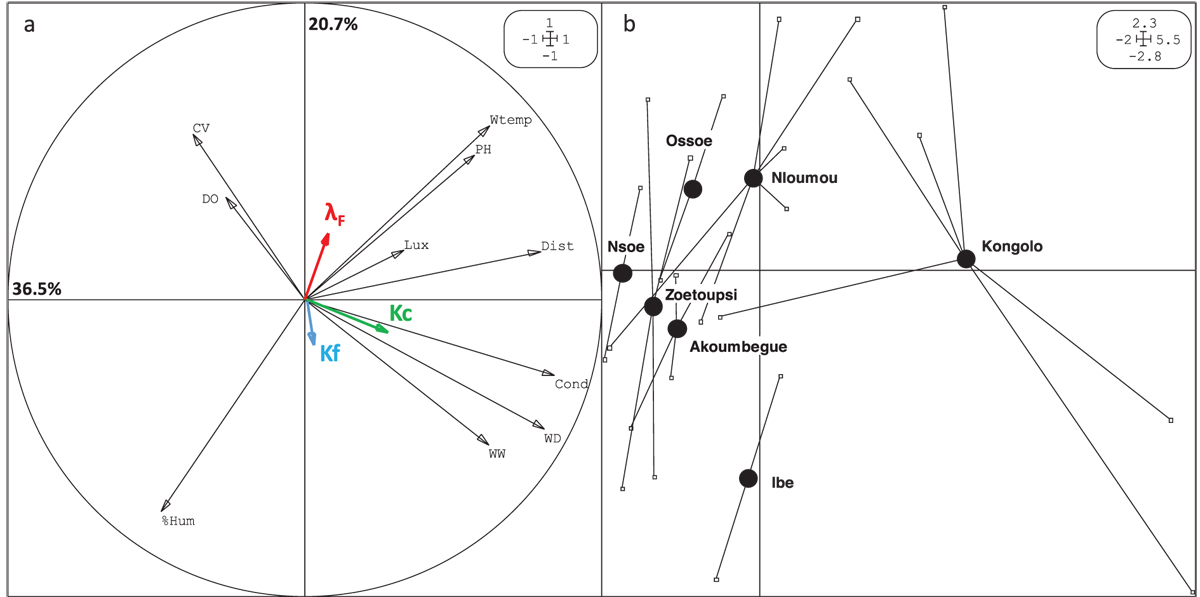
Fig. 4
Download original image
Results of the PCA analysis with the correlation circle showing the correlations among the 10 environmental factors according to the different environmental factors (a). The breakdown rates Kc (green arrow), Kf (blue arrow) and λF (red arrow) are projected as quantitative supplementary variables. Black circles, distribution of the barycentres of each stream; solid lines link station to its different streams at each season (b). CV: current velocity; %Hum: percentage of air humidity; DO: dissolved oxygen; Lux: luminosity; WW: water width; WD: water depth; Cond: conductivity; Lambda: fragmentation rates; Dist: distance to the source.
Current usage metrics show cumulative count of Article Views (full-text article views including HTML views, PDF and ePub downloads, according to the available data) and Abstracts Views on Vision4Press platform.
Data correspond to usage on the plateform after 2015. The current usage metrics is available 48-96 hours after online publication and is updated daily on week days.
Initial download of the metrics may take a while.