Fig. 2

Download original image
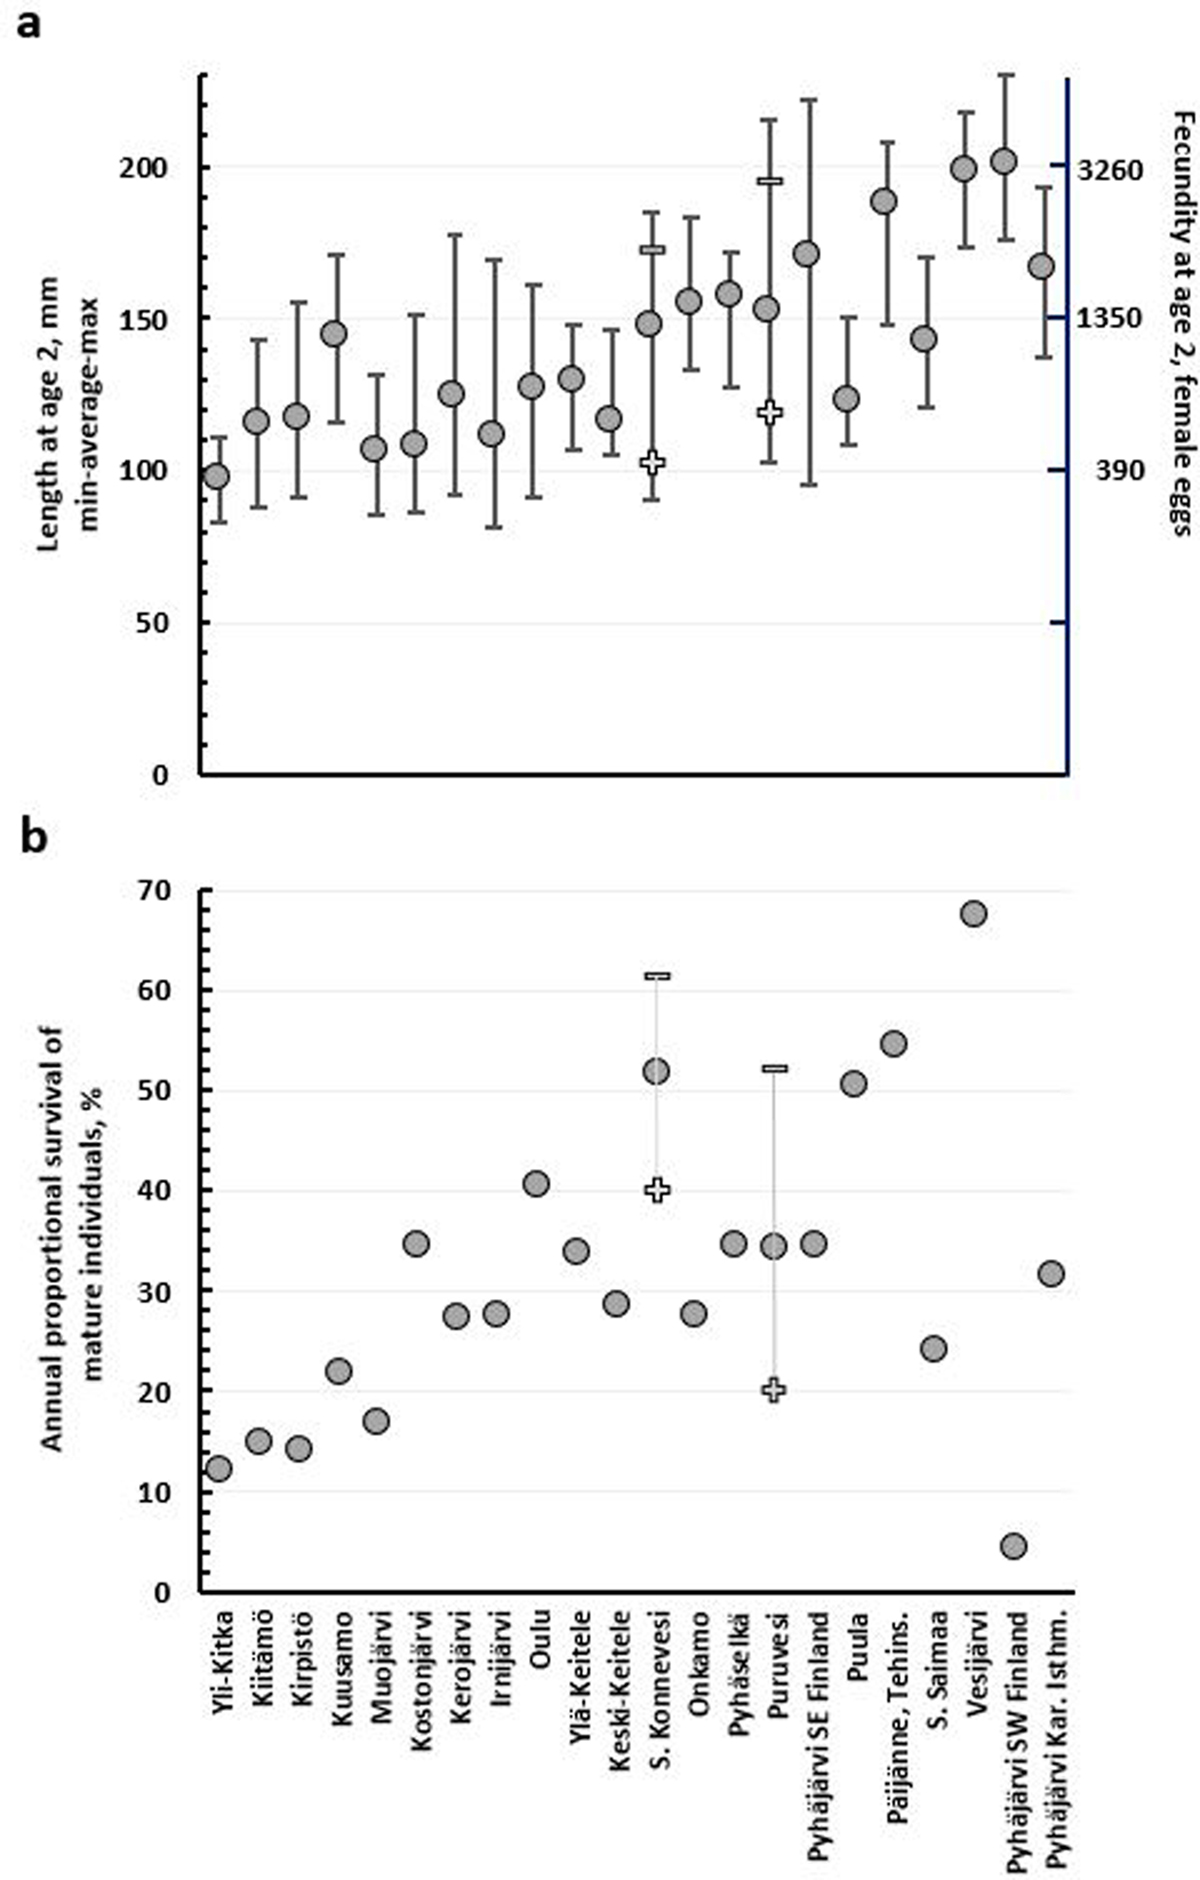
a) The von Bertalanffy model -calculated average length at maturity (age 2, L2) and fecundity (female eggs) estimates for different vendace populations put in the order of their location from north to south. The bars show the minimum and maximum annual values. b) The constant survival estimates for mature (2 yr and older, mS) vendace. The symbols + and – show the averages for abundant and sparse population regimes, respectively, in Lake S. Konnevesi and Puruvesi.
Current usage metrics show cumulative count of Article Views (full-text article views including HTML views, PDF and ePub downloads, according to the available data) and Abstracts Views on Vision4Press platform.
Data correspond to usage on the plateform after 2015. The current usage metrics is available 48-96 hours after online publication and is updated daily on week days.
Initial download of the metrics may take a while.


