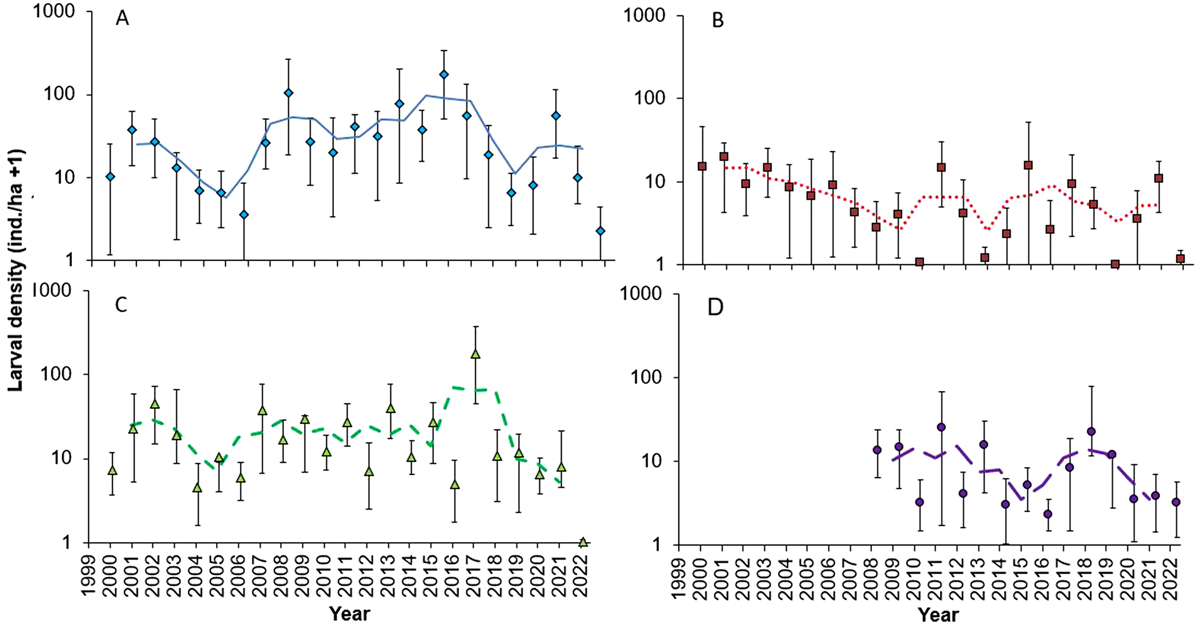
Fig. 2
Download original image
Average newly hatched whitefish larvae density in spring (y-axis logarithmic, vertical line = 95% confidence interval) and sliding mean (3 years) in A) unregulated Southern Konnevesi, B) moderately regulated Puula, C) regulated Tehinselkä (years 2000–2022) and D) regulated Ruotsalainen (years 2008–2022).
Current usage metrics show cumulative count of Article Views (full-text article views including HTML views, PDF and ePub downloads, according to the available data) and Abstracts Views on Vision4Press platform.
Data correspond to usage on the plateform after 2015. The current usage metrics is available 48-96 hours after online publication and is updated daily on week days.
Initial download of the metrics may take a while.