Fig. 3
Download original image
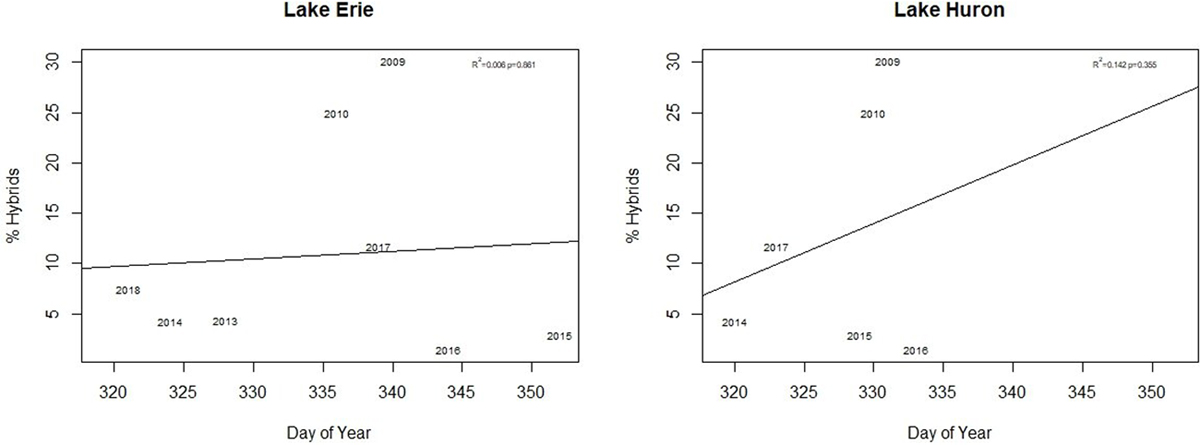
Relationship between water temperatures of Lake Huron and Lake Erie and rate of inter-lake hybrids. Each graph shows the day of the year in the fall when the water temperature first falls below 8 °C for each year in the study versus the estimated proportion of inter-lake hybrids in each year. Each point is represented by the year in which data were collected (NOAA, 2023; https://coastwatch.glerl.noaa.gov/marobs/marobs.html).
Current usage metrics show cumulative count of Article Views (full-text article views including HTML views, PDF and ePub downloads, according to the available data) and Abstracts Views on Vision4Press platform.
Data correspond to usage on the plateform after 2015. The current usage metrics is available 48-96 hours after online publication and is updated daily on week days.
Initial download of the metrics may take a while.