Fig. 2
Download original image
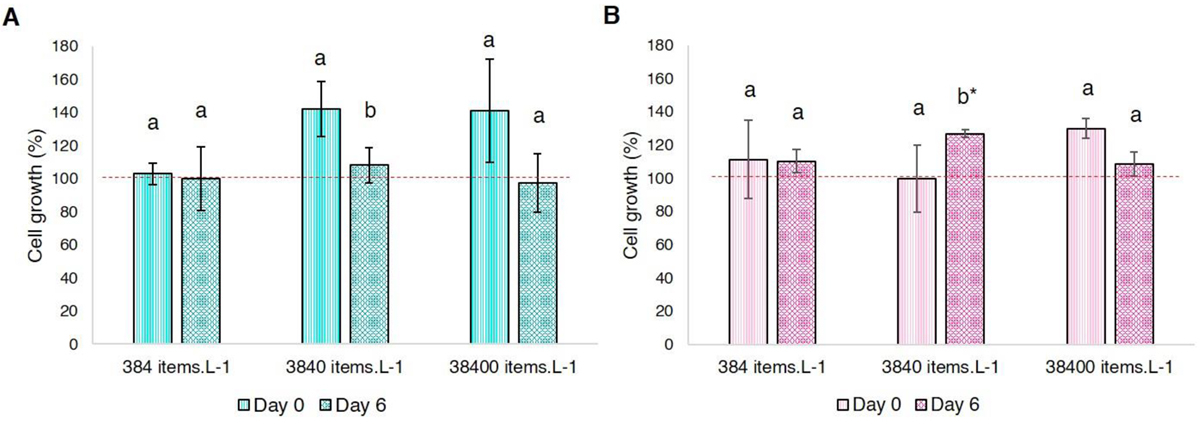
Cell growth (%), normalized to the negative control group (100%, represented by the red dashed line), and relative standard deviation of days 0 (initial) and 6 (final) of exposure to acrylonitrile-butadiene-styrene microplastics (ABS-MP) at three concentrations: 384, 3840 and 38,400 items L−1. (A) Chlorella vulgaris (in green). (B) Raphidocelis subcapitata (in pink) Equal letters indicate no significant difference and different letters indicate a significant difference between the groups at different exposure times (days 0 and 6) (Fisher's exact test). The asterisk symbol (*) represents a statistically significant difference between the treatments and the control group (Dunnet's test). p value considered significant p < 0.05.
Current usage metrics show cumulative count of Article Views (full-text article views including HTML views, PDF and ePub downloads, according to the available data) and Abstracts Views on Vision4Press platform.
Data correspond to usage on the plateform after 2015. The current usage metrics is available 48-96 hours after online publication and is updated daily on week days.
Initial download of the metrics may take a while.