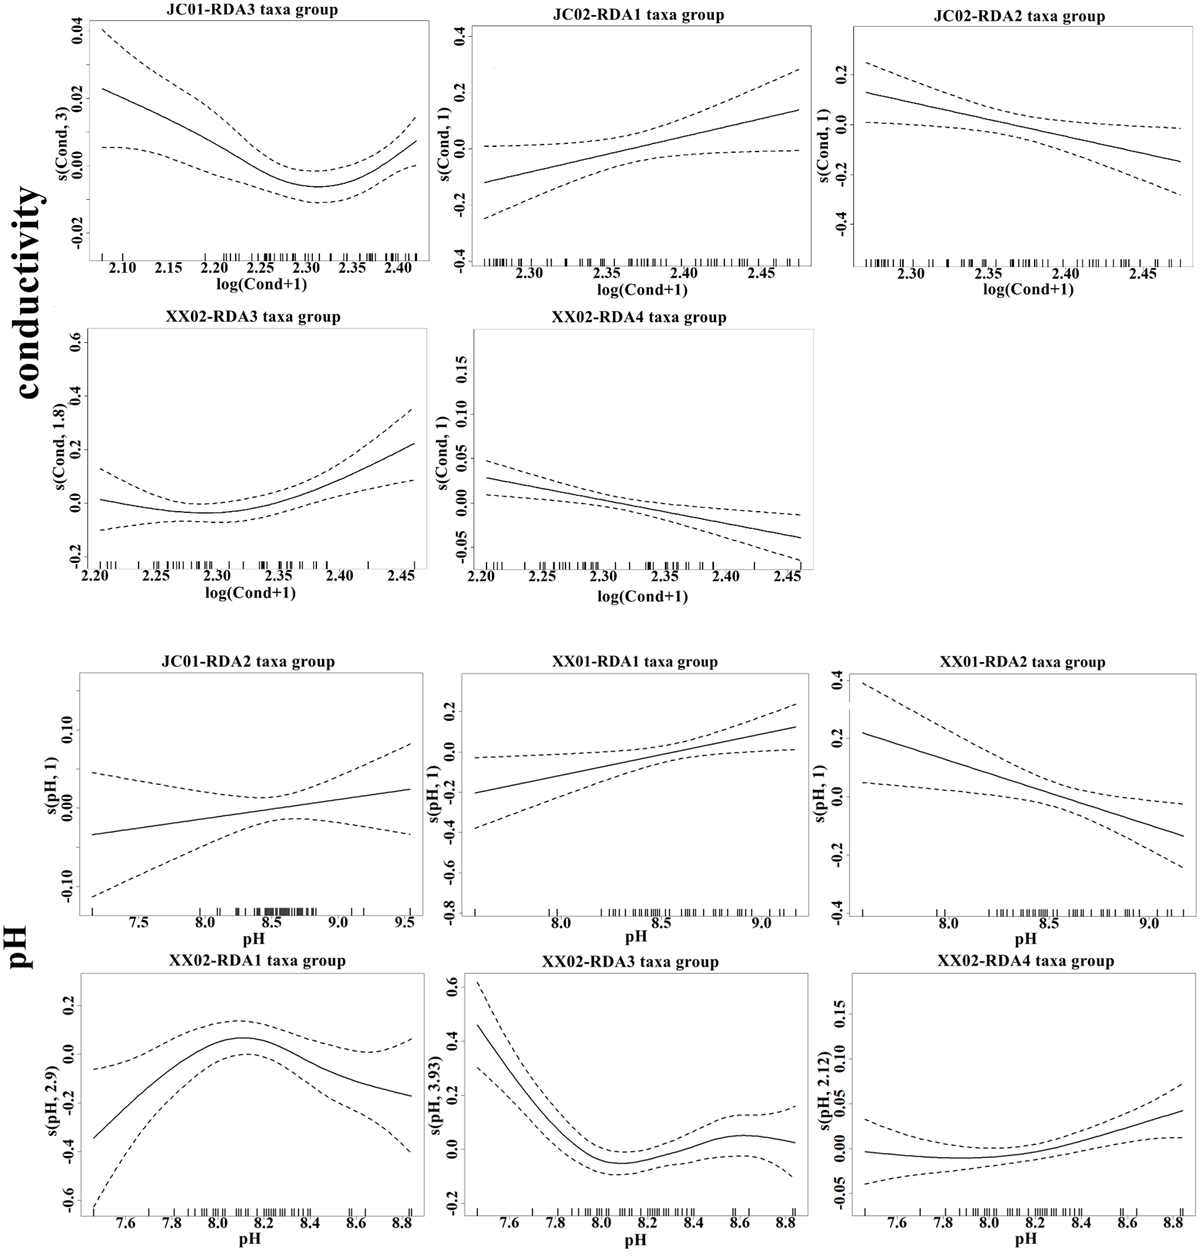
Fig. 5
Download original image
Generalized additive mixed models showing influences of conductivity, pH and TN on the relative abundance of each RDA taxa group at each site. The area within the dotted lines indicate the approximate 95% confidence intervals for the fitted functions (LOESS). The tick marks inside the panels on the x-axis show the distribution of the observed values for the two covariates. The numbers in brackets on the y-axis are the effective degrees for each smoother. Responses of each RDA taxa group to important predictors were provided in supplementary Figure 6.
Current usage metrics show cumulative count of Article Views (full-text article views including HTML views, PDF and ePub downloads, according to the available data) and Abstracts Views on Vision4Press platform.
Data correspond to usage on the plateform after 2015. The current usage metrics is available 48-96 hours after online publication and is updated daily on week days.
Initial download of the metrics may take a while.