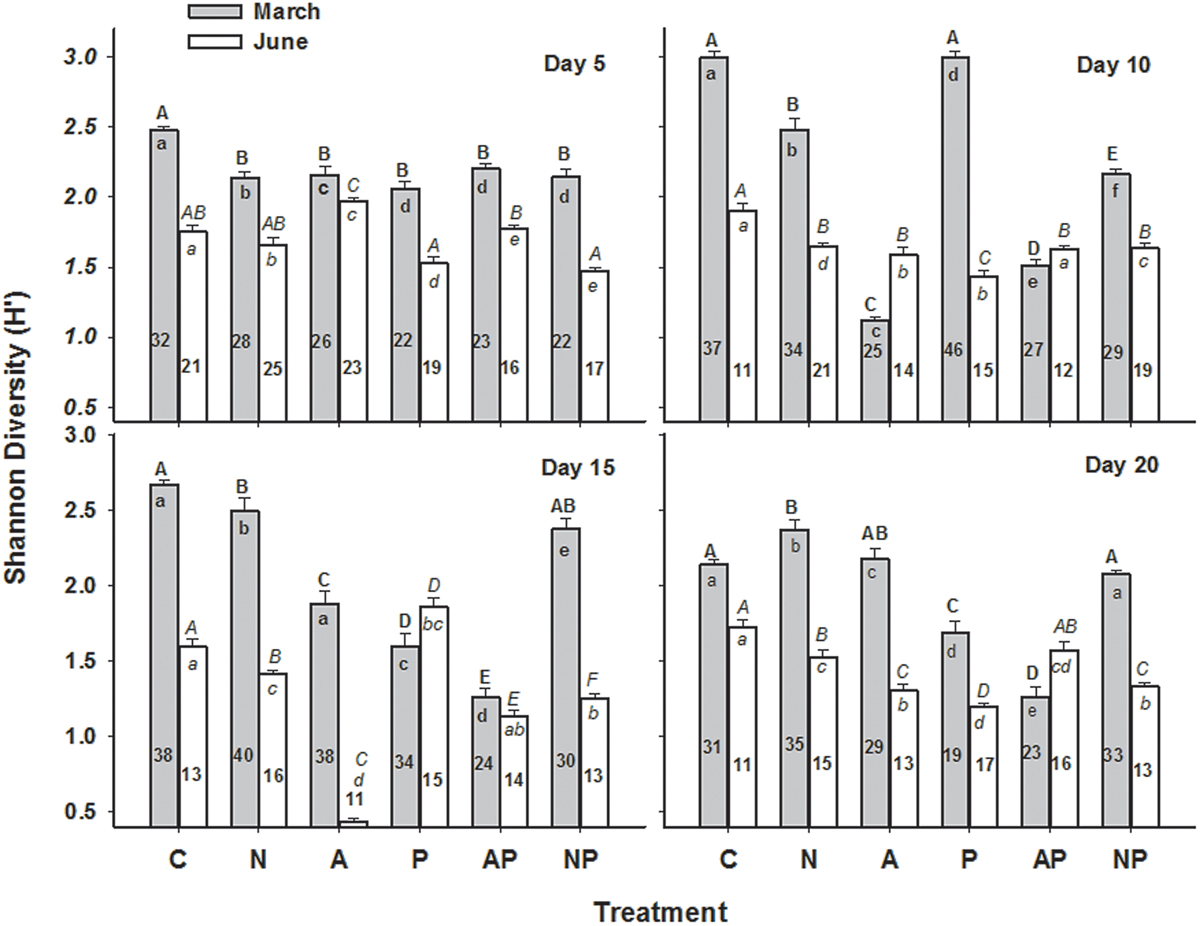
Fig. 4
Download original image
Shannon diversity (H′) and species richness of periphytic community subjected to various nutrient enrichments in March and June 2014. The bars represent species diversity, whereas numbers inside the bars show the total number of periphytic species. Details of nutrient treatment are given in Figure 2. Data means bearing different letters for different seasons, bold for March and italics for June, are significantly different from each other at p < 0.05 (Tukey's HSD test). The uppercase letters stand for shannon diversity and lowercase for species richness.
Current usage metrics show cumulative count of Article Views (full-text article views including HTML views, PDF and ePub downloads, according to the available data) and Abstracts Views on Vision4Press platform.
Data correspond to usage on the plateform after 2015. The current usage metrics is available 48-96 hours after online publication and is updated daily on week days.
Initial download of the metrics may take a while.