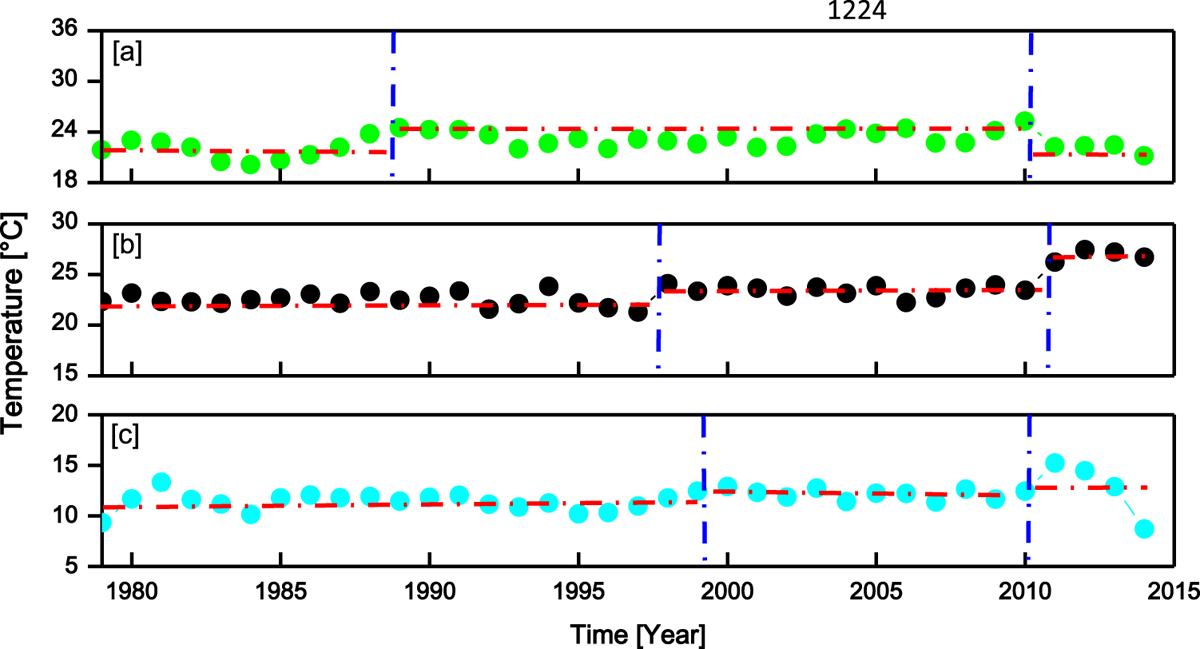
Fig. 5
Download original image
Mean summertime (June–August) of epilimnion temperatures for (a) Lake Sidi Boughaba, (b) Sidi Ali Lake and mean summertime (June–August) metalimnion temperatures for (c) Lake Sidi Ali. In (a) and (b), dash dot blue lines represent statistically significant (p < 0.5) locations of abrupt changes in epilimnion temperatures and dash dot red lines represent mean temperatures for each period. In (c) dash dot blue lines represent metalimnion temperatures for Sidi Ali show few important significant abrupt changes.
Current usage metrics show cumulative count of Article Views (full-text article views including HTML views, PDF and ePub downloads, according to the available data) and Abstracts Views on Vision4Press platform.
Data correspond to usage on the plateform after 2015. The current usage metrics is available 48-96 hours after online publication and is updated daily on week days.
Initial download of the metrics may take a while.