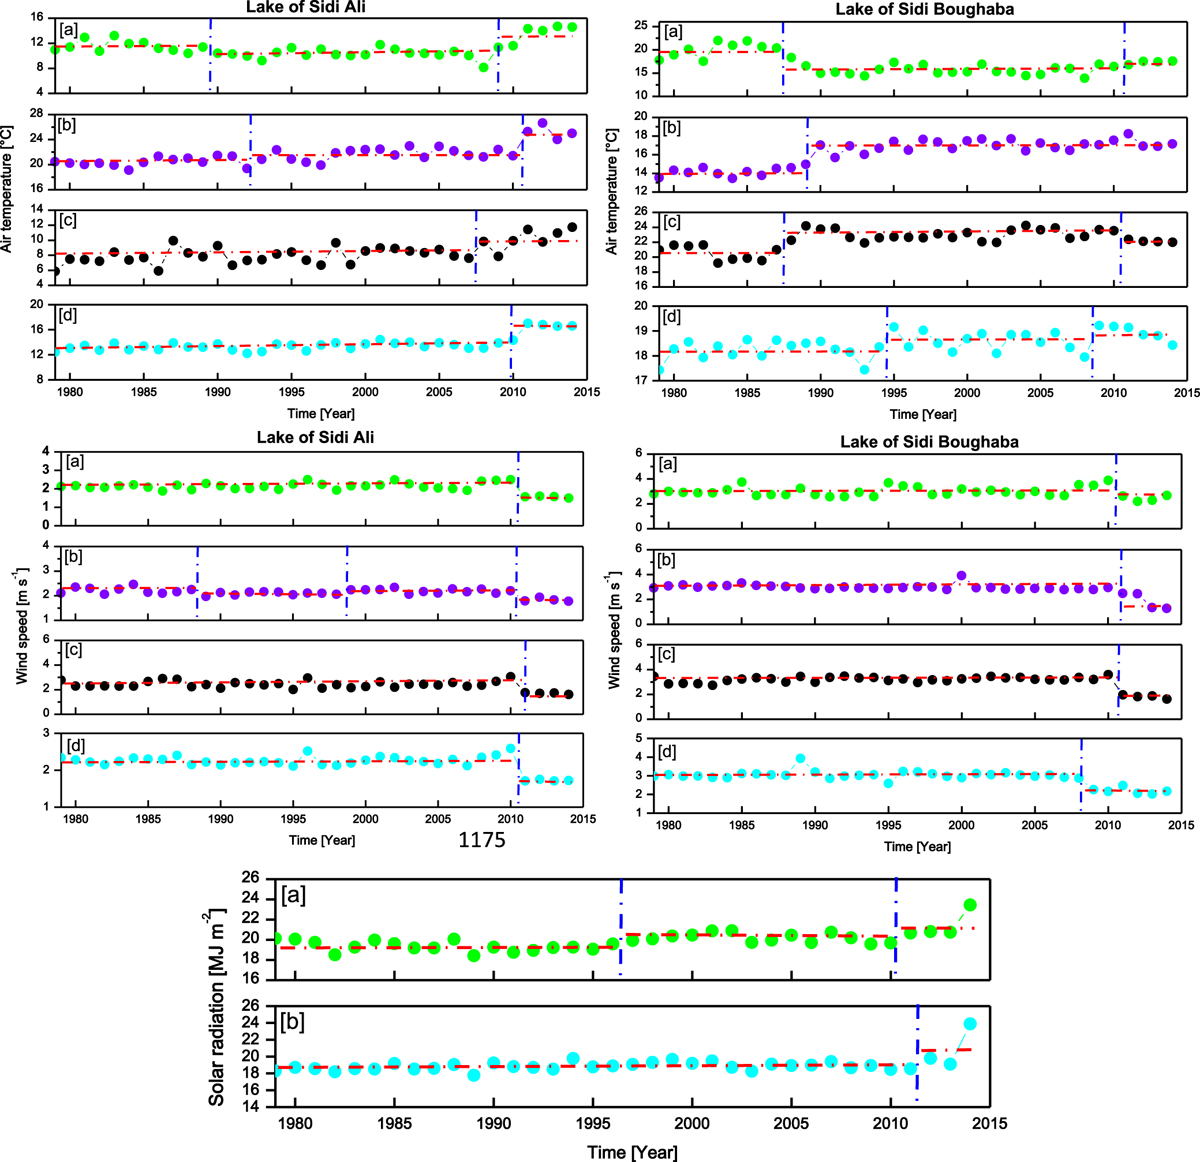
Fig. 3
Download original image
Winter [Green solid circle [a]], Summer [Violet solid circle [b]], Spring [Black solid circle [c]], and Yearly [Cyan solid circle [d]], air temperature and wind speeds for both lakes Sidi Ali and Sidi Boughaba. Blue lines in yearly, spring, summer, and winter for air temperature and wind speed figures represents abrupt changes in average yearly and each seasons. Additionally, Figure below show, [a] solar radiation for Sidi Ali and [b] for Sidi Boughaba.
Current usage metrics show cumulative count of Article Views (full-text article views including HTML views, PDF and ePub downloads, according to the available data) and Abstracts Views on Vision4Press platform.
Data correspond to usage on the plateform after 2015. The current usage metrics is available 48-96 hours after online publication and is updated daily on week days.
Initial download of the metrics may take a while.