Free Access
Fig. 1
Download original image
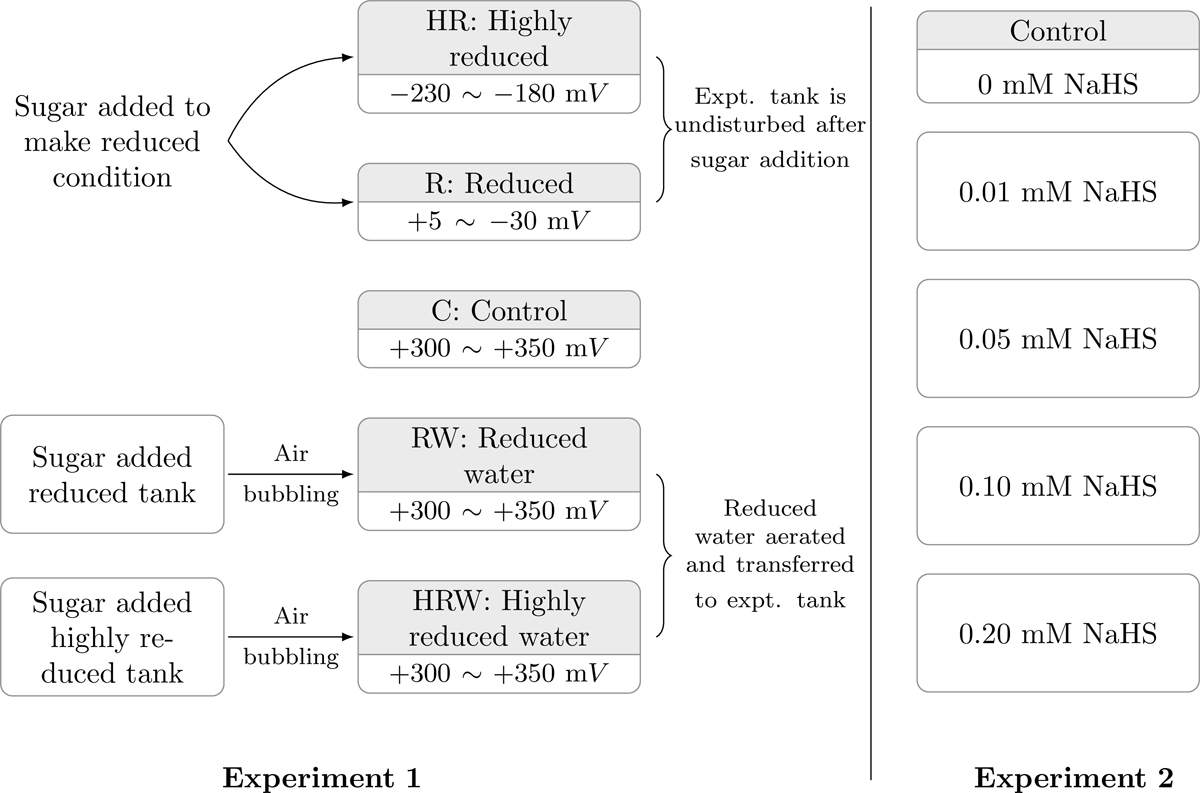
Flow chart of the experimental conditions. In the 1st series of experiments, R, HR, RW, and HRW denote reduced, highly reduced, transferred water from reduced tank and transferred water from highly reduced tank, respectively. In the 2nd series of experiments, different concentrations of H2S were applied.
Current usage metrics show cumulative count of Article Views (full-text article views including HTML views, PDF and ePub downloads, according to the available data) and Abstracts Views on Vision4Press platform.
Data correspond to usage on the plateform after 2015. The current usage metrics is available 48-96 hours after online publication and is updated daily on week days.
Initial download of the metrics may take a while.