| Issue |
Ann. Limnol. - Int. J. Lim.
Volume 57, 2021
|
|
|---|---|---|
| Article Number | 26 | |
| Number of page(s) | 8 | |
| DOI | https://doi.org/10.1051/limn/2021024 | |
| Published online | 06 December 2021 | |
Research Article
Galba truncatula (O.F. Müller, 1774) (Gastropoda, Lymnaeidae): the colonization of new stations on acid soil by low numbers of snails
Laboratory of Parasitology, Faculty of Pharmacy, 2, rue du Docteur Raymond Marcland, 87025 Limoges, France
* Corresponding author: This email address is being protected from spambots. You need JavaScript enabled to view it.
Received:
23
June
2020
Accepted:
5
November
2021
Abstract
Samples of 5, 10 or 20 adult Galba truncatula each were introduced into 25 slope rush beds and 24 road ditches on acid soil to study the colonization of these new sites by the snail. Surveys were conducted over the following eight years to determine the area where these G. truncatula colonized in these new stations and to count the number of overwintering snails in April or May. Snail populations were present in about 50% of the sites where samples of 5 snails each were introduced and in all sites when each sample included 10 or 20 snails. The average area of these habitats showed a peak before decreasing in the following years and this peak was all the more late as the sample introduced into the station increased in size. In contrast, snail abundance in all cases peaked in the second or third year after introduction and gradually decreased thereafter. In all cases, a concentration of snails was noted in the most upstream zone, whereas the number of individuals decreased gradually towards the downstream zone. These results demonstrate that a small number of snails (10 or 20 adults per sample) allow the development of a new population of G. truncatula in new acid soil stations.
Key words: Abundance / colonization / Galba truncatula / habitat / Haute-Vienne
© EDP Sciences, 2021
1 Introduction
Galba truncatula (O.F. Müller, 1774), also known as Lymnaea truncatula, is the intermediate host of the parasite Fasciola hepatica Linnaeus, 1758. It ensures the larval development of this digenean and is therefore an indispensable link in the transmission of the disease due to this parasite. This lymnaeid is widespread worldwide and is considered a native species in Europe and in northern, western and southern Asia. It is also found in several African countries as well as in the north-west of North America (Seddon et al., 2014; Dreyfuss et al., 2015) and would have been introduced in several South American countries: Argentina, Bolivia, Chili, Peru, Venezuela (Mas-Coma et al., 1999, 2005, 2009; Bargues et al., 2012) or in New Zealand (Winterbourn, 2021). Seddon et al. (2016) also indicate that this species is tolerant to pollution and easily colonizes temporary habitats so that there would be no significant threat for its future.
In the department of Haute-Vienne (central France), most of the populations of G. truncatula identified over a period of 37 years (6701 out of 7407) were observed between 160 and 400 m above sea level, while the other 706 were found between 401 and 570 m (Dreyfuss et al., 2018b). On the crystallophyllian and metamorphic soils of this area, these authors noted that the frequency of snail populations and the characteristics of their habitats showed a significant decrease when the altitude increased. However, two studies have shown that the populations of this species have been in decline since the 2000s. Compared to the number of populations counted between 1976 and 1992, this decline was 34% on the grasslands of 162 farms in Corrèze, Creuse and Haute-Vienne (Dreyfuss et al., 2016). Similarly, on the sedimentary soils of three departments bordering the Haute-Vienne department, Dreyfuss et al. (2018a) reported a 30.8% fall on the pastures of 52 farms compared to the values recorded before 1998. According to these authors, this current decrease in the number of populations is mainly due to human activity on these farms.
Given the decline in the number of populations reported by Dreyfuss et al. (2016, 2018a), it was useful to understand how the species could colonize new habitats. This type of study could only be carried out by studying the results of G. truncatula transferred from their original habitat to new areas. Experimental introductions of snail samples, each comprising 100 adult G. truncatula, have already been carried out between 1976 and 1980 by our team in 36 open drainage furrows (meadows) and 15 road ditches on acid soils. Introduced snails formed new populations in 9 grasslands and 13 road ditches with density peaks in the second or third year post-introduction (Vareille-Morel et al., 2002). These first results quickly raised a problem as the G. truncatula samples introduced by Vareille-Morel et al. (2002) each contained 100 adult snails. We therefore wondered whether the number of molluscs introduced into each drainage furrow or each road ditch was not too high in relation to the area of habitat usually colonized by G. truncatula on acid soil. Indeed, in Haute-Vienne, the area of such habitats was less than 2 m2 in 56.8% of cases (Rondelaud et al., 2011).
Under these conditions, the question arose as to whether colonization of potential new habitats could be successfully performed by using a lower number of adult G. truncatula (5, 10 or 20 per sample). In response to this problem, an eight-year experiment was carried out by introducing snails in 25 slope rush beds and 24 road ditches in the north of Haute-Vienne. All of these new habitats had a temporary source from mid-October to the following June. The number of adult snails from the previous year (overwintering molluscs) and the area colonized by the population in these new habitats were monitored during eight years in April or May, depending on the altitude of these habitats.
2 Materials and methods
2.1 Stations studied
The 25 slope rush beds and the 24 ditches concerned by this experiment are located on the following municipalities: Berneuil, Blond, Breuilaufa, Châteauponsac, Mézières-sur-Issoire, Peyrat-de-Bellac, Rancon, Saint-Junien-les-Combes, Saint-Ouen-sur-Gartempe and Villefavard (Fig. 1). The altitude of these 49 stations ranged from 187 m to 376 m. No snails have been observed in these sites since the 1970s (D. Rondelaud, personal observation). Table 1 shows the main characteristics of these rushes and ditches.
Each rush bed was located in the mesophilous zone of a swampy meadow. No predatory snail: Zonitoides nitidus (O.F. Müller, 1774) was living in these beds so that the G. truncatula after their introduction were not exposed to the predation of this zonitid in June-July (Rondelaud et al., 2006). These stations were small in size, as evidenced by the area of the source and the trickle of water flowing from it (Tab. 1). Riparian vegetation consisted of a few clumps of rushes (most often Juncus acutiflorus Ehrhart ex Hoffmann, 1791) distributed around the source and along the stream. The surroundings of the source were largely covered by algal flora and sometimes mosses, while the source itself was generally free of vegetation, with the exception of epiphytic algae. In the case of road ditches, the temporary source was at the upstream end (21 ditches) or at the lateral position (3) of the water collection. The snail Z. nitidus was also absent. The area of these water collections was much larger with values ranging from 5.3 to 10.5 m2 (Tab. 1). The clumps of rushes were more numerous there with a predominance of Juncus effusus Linnaeus, 1753. A few clumps of sedges were also present. As in the slope rushes, there was also a strong development of the algal flora in spring.
In both habitat types, predators other than Z. nitidus were also present during the eight years of the study. Tadpoles of Bufo bufo (Linnaeus, 1758) and Rana temporaria Linnaeus, 1748, have been seen irregularly in seven and two road ditches, respectively. Juveniles of Triturus helveticus (Razoumovsky, 1789) were sometimes noted in low numbers in five ditches and three slope rush beds. No bird prints were observed at these 49 stations during their summer drying. Among the invertebrates, dytiscid larvae were often present in 17 slope rush beds and 11 road ditches. The presence of Nepa cinerea Linnaeus, 1758, has only been observed in a few ditches. No larvae of Diptera Sciomyzidae were noted during the study. With the exception of dytiscid larvae which are permanently present in the stations where they live, the presence of other species has been very irregular in the sites and over time.
At these stations, the sediment consisted of sand and gravel in the case of rush beds, and a mixture of mud, sand and rare silt in the road ditches. The subsoil was granite in all cases (Chèvremont, 2008). Running water was generally present from the beginning of October until the end of May or the beginning of June with a maximum from January to the end of April. The pH of the water was between 5.8 and 6.8, while the dissolved calcium ion concentration was less than 20 mg/L (Guy et al., 1996). The continental climate is strongly attenuated by the wet winds coming from the Atlantic Ocean. Depending on the year, the average annual rainfall ranged from 800 to 1000 mm, while the average annual temperature varied from 10.5 °C to 11.5 °C according to the altitude of the stations (Rondelaud et al., 2011; Vignoles et al., 2017).
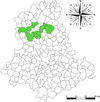 |
Fig. 1 Geographical location of the Haute-Vienne department in central France (upper map) and the municipalities (in green) on which the 38 farms are located (lower map). |
Main characteristics of the 49 stations in which adult Galba truncatula were introduced. A temporary source is present at each station.
2.2 Experimental protocol
The two populations of G. truncatula at the origin of transplanted snails lived in two open drainage furrows located in the same marshy meadow on the commune of Berneuil, department of Haute-Vienne. A total of 515 snails, measuring 5 mm or more in height and belonging to the overwintering generation, were collected between 2006 and 2011 to be introduced at the end of March in any of the 49 new stations. This range of sizes was chosen for this experiment because the snails become adults from a height of 4.5 mm (Kendall, 1953) or 4.42 mm (Smith, 1981) and can therefore lay eggs.
As the density of these snails per m2 of habitat did not exceed 40 individuals in March or April in 86.9% of cases on acidic soils of Haute-Vienne (Rondelaud et al., 2011), samples of 5, 10 or 20 adult G truncatula from either of the two original populations were introduced to these new stations according to the protocol presented in Table 1. These snails were placed at one time at the end of March at the border between water and wet soil in the case of rush beds, while they were placed in the most upstream portion of the water collection present in each road ditch. The method of introduction used for ditches is due to the fact that G. truncatula habitats are often located at the periphery of a river system (Moens, 1991; Vareille-Morel et al., 1999). The choice of the end of March for snail introduction took into account the date (mid-April) when the first egg-masses are laid by the overwintering G. truncatula in Haute-Vienne (Granet, 1996; Vareille-Morel et al., 1998).
In stations where the introduction of G. truncatula resulted in the development of a population, habitat characteristics were monitored over an eight-year period after the introduction of snails. The area of each habitat was first calculated by mapping the site according to its geometric shape and determining this value by the appropriate mathematical formula. The overwintering snails were then counted by sight as they were then in the adult stage and were all over 6 mm high. No survey was conducted at these stations in 2015. These surveys were performed at the end of March, in April or in early May (depending on the altitude of the stations and, consequently, the climatic conditions) during the other years from 2007 to 2014 and 2016 to 2019.
The rush beds were surrounded by barbed wire to avoid trampling during the grazing of cattle or sheep and no vegetation mowing was carried out during the eight years of the experiment. In 2016 and 2017, five beds were destroyed by rotary crushing due to the change of ownership in two farms. In the road ditches, no fencing was installed and vegetation in most ditches was mown by rotary crushing each year or every two years in September. From 2016, several ditches were cleared, resulting in the disappearance of the snails.
2.3 Parameters studied
The first was the frequency of new habitats colonized by G. truncatula, while the other two were the area of each habitat and the density of overwintering snails per m2 of habitat in April or May. As the introduction of G. truncatula into new stations took place over several years (see Tab. 1), the results of each parameter were expressed in relation to the serial number of the post-introduction year.
Individual values for the habitat area or the density of snails were reduced to an average, framed by a standard deviation, taking into account the type of station (rush beds or ditches), the sample size (5, 10 or 20 snails) and the serial number of the year after introduction. First, the normality of these values was first analyzed using the Shapiro-Wilk test (Shapiro and Wilk, 1965). As their distributions were not normal, the Kruskal-Wallis test was used in a second step to establish statistical significance levels. In a third step, we have also used the r pgirmess package as a post-hoc test for pairing comparisons. The various analyses were performed using software R 3.3.0 (R Core Team, 2016).
In order to analyze the distribution of G. truncatula in these new habitats, the numbers of snails were also expressed in percentages relative to the length of the sites they colonize. The values used for this study are those of the third year post-introduction at stations where samples of 20 snails have been implanted because these values are the highest.
3 Results
3.1 Number of populations
Table 2 shows the number of populations recovered over the eight years of the experiment. At the end of the first year, snails were observed in five of the 11 rushes in which samples of 5 G. truncatula each were implanted. On the other hand, the introduction of 10 or 20 snails in the other 14 beds was successful with the development of populations in all cases. The same type of result was found in roadside ditches at the end of the first year: five sites (out of 10) colonized by G. truncatula when the sample consisted of 5 molluscs, and populations in the other 14 ditches when 10 or 20 snails were introduced.
Several populations of G. truncatula disappeared during the experiment due to the destruction of their habitat: a total of five in the case of rush beds out of the 19 noted at the end of the first year and five in the case of ditches out of a total of 19 (Tab. 2). The disappearance of one population in a rush bed during the second year was not explained, while the other four beds were destroyed by rotary crushing during the seventh or eighth year. In the case of ditches, one population was destroyed in the second year by the laying of pipes on another segment of the ditch located further upstream. Another population disappeared in the fourth year due to pollution by diesel oil. The other three ditches were cleared using a shovel in the seventh or eighth year, resulting in the disappearance of the snails.
The number of Galba truncatula populations over the eight years following the introduction of this species in 49 new stations in Haute-Vienne. The results are expressed in relation to the serial number of the year post-introduction.
3.2 Surface area colonized by snails
In rush beds where samples of 5 G. truncatula have been implanted (Fig. 2a), this area peaked during the second year post-introduction (at 4 m2) before gradually decreasing until the end of the experiment (at 2.6 m2). The same variation in this area was also observed in the other two types of beds but the peak was later in the third year. No significant difference between the mean values of these peaks was noted. The differences between the areas noted during the eighth year of the experiment were also not significant.
In road ditches (Fig. 2b), the same variation as in rush beds was observed, but the peaks were later and the mean values were higher. The peak was thus noted in the fourth year (at 4.6 m2) at the sites where samples of 5 snails were introduced. In contrast, it occurred in the fifth year (at 5.8 m2) and the sixth year (at 7.6 m2) in the ditches where samples of 10 and 20 snails, respectively, have been implanted. The difference between mean peak values was significant (H = 13.87, p < 0.001) with higher values at sites where samples of 20 G. truncatula were introduced. At the end of the experiment, the means are significantly higher (H = 17.06, p < 0.001) in ditches where 20 snails had been introduced than in the other two types of sites.
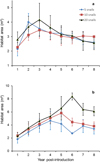 |
Fig. 2 The area colonized by Galba truncatula in 38 stations during the eight years of the experiment: slope rush beds (2a) and road ditches (2b). |
3.3 Density of overwintering snails
In rush beds (Fig. 3a), this density showed a peak during the second year (beds with samples of 5 and 10 G. truncatula) or the third year (the other beds) before gradually decreasing until the eighth year post-introduction. The averages recorded during these peaks were significantly higher (H = 20.64, p < 0.001) in the beds where samples of 20 G. truncatula have been implanted (20.3 snails per m2 of habitat instead of 16.1/m2 and 6.8/m2 in the springs with samples of 10 and 5 G. truncatula, respectively). There was also a significant difference (H = 15.64, p < 0.001) between the averages recorded in the eighth year with higher values in the beds with 20 G. truncatula per sample than in the other two types of sites.
In road ditches (Fig. 3b), the density of G. truncatula showed the same variation as in the rush beds. When samples of 5 or 10 snails have been implanted, the peak was observed during the second year with 7.3 snails/m2 and 18.0/m2, respectively. In contrast, the peak was only noted in the third year (at 18.3/m2) at sites where samples of 20 G. truncatula were introduced. Significantly higher averages in the ditches, where samples of 20 snails were introduced, were noted when peaks were compared (H = 16.95, p < 0.001) or at the end of the experiment (H = 12.90, p < 0.001).
When the peaks obtained in the rush beds and road ditches are compared, no significant difference between these means was noted, regardless of the sample size.
 |
Fig. 3 The density of overwintering Galba truncatula in 38 stations during the eight years of the experiment: slope rush beds (3a) and road ditches (3b). |
3.4 Distribution of snails in their habitat
Figure 4 shows the distribution of G. truncatula relative to the length of its habitat from the upstream source to the downstream end. The values are those that our team noted in the third year post-introduction in six rush beds and seven ditches where samples of 20 snails were implanted. In both types of stations, there was a concentration of snails over the first three metres in the upstream zone of the habitat: 65.2% of G. truncatula were counted in the case of rush beds (Fig. 4a) and 55.4% in the case of ditches (Fig.4b). The remaining molluscs were distributed over a length of 8 m in the case of rush beds and 10 m in the case of ditches with a gradual decrease in snail numbers going towards the downstream zone.
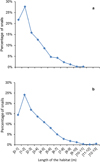 |
Fig. 4 The distribution of Galba truncatula (in percentages) relative to the length of its habitat from the upstream source to the downstream end: slope rush beds (4a) and road ditches (4b). The values are those of the stations in which samples of 20 snails have been introduced and concern the third year of experiment. Total number of lymnaeids affected by these curves: 505 (rush beds) and 555 (ditches). |
4 Discussion
The literature reports that a minimum number of individuals is required for a population to develop in a new site and remain viable with a probability of 100% over a specified period of time (Shaffer, 1981, 1987; Wang et al., 2019). According to Reed et al. (2003), this minimum viable population (MVP) size would be very specific and would depend on the environmental and biological characteristics of the species being studied. The figures put forward by the authors show a large variation according to species. Robinson and Vath (2015) reported the “50/500” rule: a minimum population size of 50 individuals is needed to control inbreeding and a minimum of 500 individuals is needed to reduce genetic drift. Other authors such as Lehmkuhl (1984) and Thomas (1990) estimate that a MVP of 500 to 1000 is an average for terrestrial vertebrates when inbreeding or genetic variability is ignored. When inbreeding effects are included, MVP estimates for many species are in the thousands. For example, Traill et al. (2007) reported that an average of 4169 individuals is required to have MVP in many species. Although the present study is limited in time (only eight years), our results showed that a minimum number of G. truncatula ranging from 5 to 20 adults per sample allowed the development of new populations in some stations on acid soil in which the presence of this species had not been observed in the previous years. Moreover, as G. truncatula is known to be a preferential selfer (Trouvé et al., 2003, 2005), it is hypothetically possible that a single individual could be at the origin of a new population. If this assumption is valid, the size of the MVP would theoretically be equal to 1, indicating that the number of 5 G. truncatula may not represent the actual MVP for this species.
In both types of stations, the average area colonized by each G. truncatula population showed a peak before decreasing in the following years. This peak was all the later as the sample introduced into the station was large: from the second to the fourth year after introduction in the case of slope rushes, from the fourth to the sixth year in the case of ditches. Two explanations can be provided to interpret these results: (i) the type of station offered for snail settlement plays a role because the area of the water collection contained in a ditch is larger than that present in a slope rush bed in the spring (Tab. 1); (ii) this time lag in habitat colonization by G. truncatula according to the size of the snail sample would be due to the species itself as this snail is known to live on the periphery of a river system (Moens, 1991) such as the upstream end of open drainage furrows (Vareille-Morel et al., 1999). An argument supporting this latter assumption is provided by Figure 3: 65.2% of snails in the case of rush beds and 55.4% in the case of ditches were counted on the first three metres of each water collection.
In stations where a population of G. truncatula has developed, the density of snails showed a peak in the second or third year post-introduction before gradually decreasing thereafter. These results are consistent with the report by Vareille-Morel et al. (2002) and indicate that this variation in snail abundance is independent of the number of lymnaeids contained in each sample. The most valid hypothesis for commenting on these results is to admit that the number of snails in each habitat would be progressively regulated by biotic or environmental factors, and that such regulation would begin in the second or third year after introduction. The distribution of numbers throughout the habitat (Fig. 4) showed a concentration of snails in the upstream zone of each rush bed or each ditch, while the number of individuals decreased sharply by going towards the downstream zone of the habitat. If one excludes the possible dispersion of some snails by swimming on the surface of the water or by rafting (Kappes and Haase, 2012), the displacement of G. truncatula towards the downstream seems to be limited to eight metres in the case of rush beds and to ten metres in the case of ditches. As G. truncatula is able to migrate against the current to the upstream end of its habitat in winter and spring (Rondelaud et al., 2005a, b), the downstream dispersion of individuals was smaller. The vegetation present in both types of stations cannot be incriminated to explain this result because the abundance of macrophytes is quite low throughout the water collections studied. As for the location of habitats on the periphery of a river system, the limited dispersion of individuals downstream appears to be a specific trait of G. truncatula. Further studies are still needed to clarify this dispersal of snails downstream throughout the year in order to determine the area from which the downstream migrating individuals leave and the means used by these snails to move.
This ability of G. truncatula to colonize new habitats with small snail samples can be largely explained by the genetic structure of this species. The mollusc is known to be a preferential selfer in its habitat (Trouvé et al., 2003, 2005; Meunier et al., 2004a), which in theory allows the colonization of a site from a single individual. In addition, the low level of polymorphism and the high heterozygote deficiency observed in this species (Meunier et al., 2004b; Hurtrez-Boussès et al., 2006) may be factors that explain G. truncatula's ability to colonize.
In conclusion, a sample of 10 or 20 adult G. truncatula allowed the development of a new population on acid soil when introduced into a potential new station provided there was a temporary water source. This population showed a peak in the second or third year post-introduction before gradually returning to lower values in subsequent years. These results show that a small number of snails allow the development of a new population of G. truncatula in new stations on acid soil.
References
- Bargues MD, Artigas P, Khoubbane M, Ortiz P, Naquira C, Mas-Coma S. 2012. Molecular characterisation of Galba truncatula, Lymnaea neotropica and L. schirazensis from Cajamarca, Peru and their potential role in transmission of human and animal fascioliasis. Parasit Vectors 5: 174. [CrossRef] [PubMed] [Google Scholar]
- Chèvremont P. 2008. Carte géologique harmonisée du département de la Haute-Vienne (87). Notice technique. BRGM/RP-57447-FR, Orléans, France. [Google Scholar]
- Dreyfuss G, Vignoles P, Rondelaud D, Cabaret J. 2015. The mud snail (Galba truncatula). Ecology, parasitism and control. Lambert Academic Publishing, Sarrebruck, Germany. [Google Scholar]
- Dreyfuss G, Vignoles P, Rondelaud D. 2016. Current decline in the number and size of populations of Galba truncatula and Omphiscola glabra, intermediate hosts of Fasciola hepatica, on the acidic soils of Central France. Parasite 23: 46. [CrossRef] [EDP Sciences] [PubMed] [Google Scholar]
- Dreyfuss G, Vignoles P, Rondelaud D. 2018a. Galba truncatula and Omphiscola glabra (Gastropoda, Lymnaeidae): present decline in populations living on sedimentary soils in central France. Ann Limnol-Int J Lim 54: 11. [CrossRef] [EDP Sciences] [Google Scholar]
- Dreyfuss G, Vignoles P, Rondelaud D. 2018b. Relationships between the distribution of Galba truncatula (Gastropoda: Lymnaeidae) climatic conditions and the altitude of municipalities in Haute-Vienne (France). Ann Limnol-Int J Lim 54: 19. [Google Scholar]
- Granet C. 1996. Les pontes d'un mollusque, Lymnaea truncatula Müller. Les conséquences du parasitisme sur l'activité reproductrice de la limnée. PharmD Thesis, University of Limoges, France. [Google Scholar]
- Guy F, Rondelaud D, Botineau M, Dreyfuss G, Ghestem A. 1996. Etude de relations entre les plantes les plus fréquentes et l'abondance de Lymnaea truncatula Müller, vecteur de Fasciola hepatica Linné dans les prairies marécageuses sur sol acide. Rev Méd Vét 147: 465–470. [Google Scholar]
- Hurtrez-Boussès S, Hurtrez JE, Turpin H, et al. 2006. Hydrographic network structure and population genetic differentiation in a vector of fasciolosis, Galba truncatula. Infect Genet Evol 10: 178–183. [Google Scholar]
- Kappes H, Haase P. 2012. Slow, but steady: dispersal of freshwater molluscs. Aquat Sci 74: 1–14. [CrossRef] [Google Scholar]
- Lehmkuhl J. 1984. Determining size and dispersion of minimum viable populations for land management planning and species conservation. Environ Manag 8: 167–176. [CrossRef] [Google Scholar]
- Mas-Coma S, Anglés R, Esteban JG, et al. 1999. The Northern Bolivian Altiplano: a region highly endemic for human fascioliasis. Trop Med Int Health 4: 454–467. [CrossRef] [PubMed] [Google Scholar]
- Mas-Coma S, Bargues MD, Valero MA. 2005. Fascioliasis and other plant-borne trematode zoonoses. Int J Parasitol 35: 1255–1278. [CrossRef] [PubMed] [Google Scholar]
- Mas-Coma S, Valero MA, Bargues MD. 2009. Fasciola, lymnaeids and human fascioliasis, with a global overview on disease transmission, epidemiology, evolutionary genetics, molecular epidemiology and control. Adv Parasitol 69: 41–146. [CrossRef] [PubMed] [Google Scholar]
- Meunier C, Hurtrez-Boussès S, Jabbour-Zahab R, Durand P, Rondelaud D, Renaud F. 2004a. Field and experimental evidence of preferential selfing in the freshwater mollusc Lymnaea truncatula (Gastropoda: Pulmonata). Heredity 92: 316–322. [CrossRef] [PubMed] [Google Scholar]
- Meunier C, Hurtrez-Boussès S, Durand P, Rondelaud D, Renaud F. 2004b. Small effective population sizes in a widespread selfing species, Lymnaea truncatula (Gastropoda: Pulmonata). Mol Ecol 13: 2535–2543. [CrossRef] [PubMed] [Google Scholar]
- Moens R. 1991. Factors affecting Lymnaea truncatula populations and related control measures. J Med Appl Malacol 3: 73–84. [Google Scholar]
- R Core Team. 2016. R: a language and environment for statistical computing. R Foundation for Statistical Computing, Vienna. Available on: https://www.R-project.org (accessed on 19 October 2018). [Google Scholar]
- Reed DH, Grady JJO, Brook BW, Ballou JD, Frankham R. 2003. Estimates of minimum viable population sizes for vertebrates and factors influencing those estimates. Biol Conserv 113: 23–24. [CrossRef] [Google Scholar]
- Robinson SK, Vath CL. 2015. Minimum viable population. Encyclopedia Britannica. Available at: https://www.britannica.com/science/minimum-viable-population (accessed on 24 March 2020). [Google Scholar]
- Rondelaud D, Hourdin P, Vignoles G, Dreyfuss G. 2005a. The contamination of wild watercress with Fasciola hepatica in central France depends on the ability of several lymnaeid snails to migrate upstream towards the beds. Parasitol Res 95: 305–309. [CrossRef] [PubMed] [Google Scholar]
- Rondelaud D, Hourdin P, Abrous M, Vignoles P, Dreyfuss G. 2005b. Galba truncatula (Lymnaeidae): la colonisation de l'habitat au cours de l'année et la dynamique des générations annuelles chez deux populations vivant sur des berges de rivière en amont d'un barrage. Ann Sci Limousin 16: 34–45. [Google Scholar]
- Rondelaud D, Vignoles P, Dreyfuss G, Mage C. 2006. The control of Galba truncatula (Gastropoda: Lymnaeidae) by the terrestrial snail Zonitoides nitidus on acid soils. Biol Control 39: 290–299. [Google Scholar]
- Rondelaud D, Hourdin P, Vignoles P, Dreyfuss G, Cabaret J. 2011. The detection of snail host habitats in liver fluke infected farms by use of plant indicators. Vet Parasitol 181: 166–173. [CrossRef] [PubMed] [Google Scholar]
- Seddon MB, Kebapçı U, Van Damme D. 2014. Galba truncatula. The IUCN Red List of Threatened Species. Version 2014.3. Available on: www.iucnredlist.org (accessed on 2 March 2015). [Google Scholar]
- Shaffer ML. 1981. Minimum population sizes for species conservation. BioScience 31: 131–134. [CrossRef] [Google Scholar]
- Shaffer M. 1987. Minimum viable populations: coping with uncertainty, in: Viable Populations for Conservation, edited by M.E. Soulé. Cambridge, UK: Cambridge University Press, pp. 69–86. [Google Scholar]
- Shapiro SS, Wilk MB. 1965. An analysis of variance test for normality (complete samples). Biometrika 52: 591–611. [Google Scholar]
- Smith G. 1981. Copulation and oviposition in Lymnaea truncatula (Müller). J Mollus Stud 47: 108–111. [CrossRef] [Google Scholar]
- Thomas CD. 1990. What do real population dynamics tell us about minimum viable population sizes? Conserv Biol 4: 324–327. [CrossRef] [Google Scholar]
- Traill LW, Bradshaw CJA, Brook BW. 2007. Minimum viable population size: a meta-analysis of 30 years of published estimates. Biol Conserv 139: 159–166. [CrossRef] [Google Scholar]
- Trouvé S, Degen L, Goudet J. 2005. Ecological components and evolution of selfing in the freshwater snail Galba truncatula. J Evol Biol 18: 358–370. [Google Scholar]
- Trouvé S, Degen L, Renaud F, Goudet J. 2003. Evolutionary implications of a high selfing rate in the freshwater snail Lymnaea truncatula. Evolution 57: 2303–2314. [CrossRef] [PubMed] [Google Scholar]
- Vareille-Morel C, Abrous M, Dreyfuss G, Rondelaud D. 1998. Oviposition behaviour of Lymnaea truncatula in central France. J Mollus Stud 64: 387–391. [CrossRef] [Google Scholar]
- Vareille-Morel C, Dreyfuss G, Rondelaud D. 1999. The characteristics of habitats colonized by three species of Lymnaea in swampy meadows on acid soil: their interest for fasciolosis control. Ann Limnol-Int J Lim 35: 173–178. [CrossRef] [EDP Sciences] [Google Scholar]
- Vareille-Morel C, Rondelaud D, Dreyfuss G. 2002. Experimental colonization of new habitats by Galba truncatula O.F. Müller (Gastropoda: Lymnaeidae) in central France and their susceptibility to experimental infection with Fasciola hepatica. Ann Limnol-Int J Lim 38: 35–40. [CrossRef] [EDP Sciences] [Google Scholar]
- Vignoles G, Dreyfuss G, Rondelaud D. 2017. Detection of habitats colonized by Omphiscola glabra (Gastropoda: Lymnaeidae) on acid soils using indicator plants. Ann Limnol-Int J Limnol 53: 261–269. [CrossRef] [EDP Sciences] [Google Scholar]
- Wang T, Fujiwara M, Gao X, Liu H. 2019. Minimum viable population size and population growth rate of freshwater fishes and their relationships with life history traits. Sci Rep 9: 3612. [CrossRef] [PubMed] [Google Scholar]
- Winterbourn M. 2021. Guide to the freshwater Mollusca of New Zealand (fully revised February 2021). Availale on: https://www.researchgate.net/publication/349623988_Guide_to_the_freshwater_Mollusca_of_New_Zealand_fully_revised_February_2021 (accessed on 14 October 2021). [Google Scholar]
Cite this article as: Dreyfuss G, Vignoles P, Rondelaud D. 2021. Galba truncatula (O.F. Müller, 1774) (Gastropoda, Lymnaeidae): the colonization of new stations on acid soil by low numbers of snails. Ann. Limnol. - Int. J. Lim. 57: 26
All Tables
Main characteristics of the 49 stations in which adult Galba truncatula were introduced. A temporary source is present at each station.
The number of Galba truncatula populations over the eight years following the introduction of this species in 49 new stations in Haute-Vienne. The results are expressed in relation to the serial number of the year post-introduction.
All Figures
|
Fig. 1 Geographical location of the Haute-Vienne department in central France (upper map) and the municipalities (in green) on which the 38 farms are located (lower map). |
| In the text | |
|
Fig. 2 The area colonized by Galba truncatula in 38 stations during the eight years of the experiment: slope rush beds (2a) and road ditches (2b). |
| In the text | |
|
Fig. 3 The density of overwintering Galba truncatula in 38 stations during the eight years of the experiment: slope rush beds (3a) and road ditches (3b). |
| In the text | |
|
Fig. 4 The distribution of Galba truncatula (in percentages) relative to the length of its habitat from the upstream source to the downstream end: slope rush beds (4a) and road ditches (4b). The values are those of the stations in which samples of 20 snails have been introduced and concern the third year of experiment. Total number of lymnaeids affected by these curves: 505 (rush beds) and 555 (ditches). |
| In the text | |
Current usage metrics show cumulative count of Article Views (full-text article views including HTML views, PDF and ePub downloads, according to the available data) and Abstracts Views on Vision4Press platform.
Data correspond to usage on the plateform after 2015. The current usage metrics is available 48-96 hours after online publication and is updated daily on week days.
Initial download of the metrics may take a while.