| Issue |
Ann. Limnol. - Int. J. Lim.
Volume 57, 2021
|
|
|---|---|---|
| Article Number | 3 | |
| Number of page(s) | 10 | |
| DOI | https://doi.org/10.1051/limn/2020028 | |
| Published online | 19 January 2021 | |
Research Article
Bottom-up and top-down effects on phytoplankton functional groups in Hulun Lake, China
1
College of Wildlife and Protected Area, Northeast Forestry University, Harbin, China
2
Hulunbuir Academy of Inland Lakes in Northern Cold and Arid Areas, Hulunbuir City, Inner Mongolia 021008, China
3
Everglades Research and Education Center, Soil and Water Sciences Department, University of Florida, Belle Glade, FL, USA
* Corresponding author: This email address is being protected from spambots. You need JavaScript enabled to view it.
; This email address is being protected from spambots. You need JavaScript enabled to view it.
Received:
10
November
2020
Accepted:
14
December
2020
Abstract
The debates about the extent to which phytoplankton in freshwater ecosystems are regulated by top-down or bottom-up forces have been ongoing for decades. This study examines the effects of bottom-up and top-down factors on the phytoplankton functional groups in a eutrophic lake. Phytoplankton and zooplankton were sampled and physical-chemical variables measured from May 2019 to October 2019 in Lake Hulun, China. Approximately 43 phytoplankton species were observed and grouped into 23 functional groups. For the zooplankton, about 27 species were observed and classified into 8 functional groups. The study revealed that the bottom-up effects of physical-chemical variables on some phytoplankton functional groups was stronger than the top-down effects of zooplankton. Water temperature (WT), total phosphorus (TP), total nitrogen (TN), conductivity (Cond), water transparency (SD), and dissolved oxygen (DO) significant influence the biomass of the phytoplankton functional groups. The biomass of phytoplankton functional groups was influenced positively by nutrient availability likely because nutrients influence the growth and reproduction of phytoplankton in freshwater. WT and DO had a positive influence on biomass of phytoplankton functional groups. Conversely, phytoplankton biomass revealed a decreasing trend when SD and Cond significantly increased. This study showed that zooplankton functional groups were positively correlated with phytoplankton biomass implying that the top-down control of phytoplankton by the zooplankton in the lake is not strong enough to produce a negative effect. It is evident that the zooplankton functional groups in Lake Hulun are controlled more by bottom-up force than top-down.
Key words: Phytoplankton / zooplankton / bottom-up / top-down / functional group
© EDP Sciences, 2021
1 Introduction
Phytoplankton and zooplankton are not only among the most important organisms in aquatic systems but also serve as key indicators for water quality assessment (Cadotte et al., 2011; Li et al., 2020; Mwagona et al., 2018). In lakes, phytoplankton are the main primary producer while zooplankton are predators, preying on phytoplankton. Zooplankton also acts as a crucial link in the aquatic food web between the primary producers (phytoplankton) and higher consumers. Studies have revealed season changes in plankton communities (Liu et al., 2010; Ma et al., 2019a), which occur not as a change in plankton communities density, species number, diversity and biomass but also as seasonal changes in plankton community structure (Ke et al., 2008; Vallina et al., 2017). These changes are mainly impelled by physical-chemical (bottom-up effects) and predation (top-down effects) through the biological aquatic food web (Doi et al., 2013; Li et al., 2020).
According to White (1978) and Li et al. (2020), the bottom-up effect means that a lower trophic level in the biological food web affects the aquatic community structure of higher trophic levels by means of resource restrictions. On the other hand, top-down effect means a higher trophic level in the aquatic system influences the community structure of a lower trophic level through predation (Carpenter et al., 1985; Li et al., 2020). The effect of predation (top-down effects) has been hypothesized to be strong at the top of the aquatic biological food web and weakens towards the bottom, while the influence of physical-chemical (bottom-up effects) is remarkably stronger at the bottom of aquatic food web and dwindles further up in the trophic level (McQueen et al., 1986). Phytoplankton species composition and density has been shown to be influenced by nutrients through bottom-up effects, whereas predation by zooplankton (top-down effect) controls the distribution, abundance and size of phytoplankton (Carignan and Neiff, 1992; Nicolle et al., 2011). For instance, Hongjun et al. (2014) revealed that the bottom-up effects of environmental variable had a strong influence on phytoplankton. While analyzing the effects of predation by zooplankton and nutrients on phytoplankton biomass in a eutrophic reservoir in Brazil. dos Santos Severiano et al. (2012) showed that (top-down effect) predation by zooplankton had significant influence on phytoplankton. Experiments in microcosm have shown that zooplankton are strongly preyed by fish, whereas phytoplankton has been found to be controlled more by the bottom-up effects of physical-chemical parameters (Sinistro et al., 2007). While modeling top-down and bottom-up effect on the trophic structure of eutrophic and oligotrophic lakes (McQueen et al., 1986) depicted that phytoplankton production is controlled primarily by nutrients and that the effect of predation is dependent on zooplankton size.
The importance of bottom-up and top-down effects on phytoplankton abundance and community structure is well documented in marine systems (Metaxas and Scheibling, 1996; Smith and Lancelot, 2004), and some freshwater lakes in China (Li et al., 2020). However, no study has been conducted in Lake Hulun in China to assess the relative importance of bottom-up and top-down effects in regulating phytoplankton functional groups. Lake Hulun is the largest lake in northern China forming an important ecological corridor in northeast China. The lake plays a key role in climate regulation, water resources conservation, averting desertification and maintaining the balance of the grassland ecosystem. However, Lake Hulun has been suffering from eutrophication since 1980s due to high levels of nutrients in the aquatic environment (Li et al., 2008). Studies have revealed that the most important nutrient source in the lake is from the hay which is being flowed by wind from the vast Hunlunbier Grassland (Chuai et al., 2012; Wang, 2006). Eutrophication of lakes such as Hulun put critical challenges to the lake managers and limnologists who are trying to treat and remediate the water body. These challenges arise mainly from how to formulate the criteria and standard of nutrients for the lake based on factors such as the nutrients and biological variable (e.g. phytoplankton). Therefore, being a component of biological variable, it is important to explore the buttom-up and top-down effects in phytoplankton functional groups within Lake Hulun, as the dynamics and structure of phytoplankton communities play a crucial role in the lake. Understanding the influence of bottom-up and top-down effects in freshwater lakes would provide meaningful evidence for better management. This study examines the effects of bottom-up (physical-chemical) and top-down (predation) factors on the phytoplankton functional groups in the eutrophic Hulun Lake; testing the hypothesis that bottom-up effects has a more significant influence on the phytoplankton functional groups than the top-down effects of zooplankton.
2 Materials and methods
2.1 Study area and sampling sites
The study was conducted in Lake Hulun also known as Hulun Pond or Dalai Lake. Lake Hulun is the largest lake in northern China and fourth largest freshwater lake in China (Li et al., 2008). It is located in the west of the Hulun Buir Grassland (48°31′−49°20′N, 116°58′−117°48′E), between New Barag Left Banner, New Barag Right Banner, and Manzhouli City ( Fig. 1). The lake covers an area of about 2339 km2 with an average width of 32 km. The maximum water depth of Lake Hulun is about 8 m and the water storage capacity is 13.2 billion m3. The lake receives water from direct precipitation and direct surface runoff. The main rivers flowing into Lake Hulun include Kherlen River and Urson River between Baikal Lake and Lake Hulun. Xinkai River located in the northeast of Lake Hulun also drains its water into the lake. Hailar River which is a man-made river created by diversion of rivers into the lake also is an important source of water to the lake. The mean annual precipitation received in this area is between 247 and 319 mm, and approximately 80–86% of the annual precipitation falls in June-September (Li et al., 2019).
A total of 10 sampling sites were selecting taking into consideration the ecological environment characteristics of Lake Hulun. The sites included four located at the discharge points of the rivers into the lake (S1-Xinkai River Estuary, S4-Kherlen River Estuary, S6-Urson River Estuary and S7-Hailar River Estuary); two sites, S2 and S3 were located on the western side of Lake Hulun; sites S5 and S6 were located on the eastern side of the lake; and sites S8 and S10 were located in the central regions of the lake (Fig. 1).
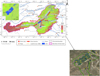 |
Fig. 1 (Top) Map of Hulun Lake drainage basin; (bottom) ten sampling locations within Lake Hulun and surrounding drainage area in Heilongjiang, China. |
2.2 Sampling collection and analysis
At every sampling site, physical-chemical variables including water temperature (WT), pH, conductivity (Cond), and dissolved oxygen (DO) were measured directly in the field using a portable multi-probe (YSI 6600, YSI Inc., USA). Secchi disk was used to measure water transparency (SD) in the field. Water samples for nutrients analysis were collected, placed in a cooler box and transported to the laboratory for analysis. Total nitrogen (TN), total phosphorus (TP) and chemical oxygen demand (COD) were analyzed according to the standard methods for China (MEP Ministry of Environmental Protection, 2002).
Replicates of phytoplankton samples (1 L at each site) were collected, put in a labeled bottle and immediately fixed with Lugol's solution. The phytoplankton samples were allowed to sediment for 48 h and then concentrated to 30 mL. Phytoplankton were identified by referring to the identification key of Hu (2006) and counted using an inverted microscope at 400× magnification. Phytoplankton species were classified into functional groups (FGs) according to (Padisák et al., 2009) and (Reynolds et al., 2002). Biovolume (mm3/L) of phytoplankton was estimated according to the solid geometric shape, and cell volumes of at least 40 algal units were estimated by approximation to the nearest solid geometric solid. Conversion of biovolume into biomass was done as 1 mm3/L = 1 mg/L as described by (Ma et al., 2019a).
For the zooplankton samples, 20 L of water were filtered through plankton net (mesh size 64 mm) and the samples were transferred into specimen bottles (pre filed with 4% formaldehyde solution). The concentrated zooplankton samples were allowed to settle in a 1 L jar for 24 h before identification and enumeration. The zooplankton were identified by referring to species keys (Chen et al., 1974; Haney et al., 2013; Kotov et al., 2013) using an inverted microscope (INVERSO 3000 (TC-100) CETI) at 400× magnification. Using a wide-mouthed pipette, a 1 ml of zooplankton sample was taken and poured into the counting cell of the Sedgewick Rafter and allowed to settle, followed by count. The counting process was made in triplicate for each sample of the plankton. The zooplankton species were classified into functional groups based on their body size/length and mode of feeding (Benedetti et al., 2015; Benedetti et al., 2018; Ma et al., 2019b; Mwagona et al., 2018). Biomass of the zooplankton was computed by dividing wet weight (mg) obtained from length–weight relation of the species to the volume of water (L) filtered (Sun et al., 2010).
2.3 Statistical analysis
The significance of the changes in physical chemical variables, the biomass of phytoplankton and zooplankton functional groups in water was tested with post hoc tests: Tukey's HSD (honestly significant difference) test for comparing groups with uneven lot sizes (Statsoft, 1995). It was assumed that the significance level was 0.05. To test the significant bottom-up or top-down influence on phytoplankton functional groups in Lake Hulun, redundancy analysis (RDA) was used after the detrended corresponding analysis (DCA) revealed that the gradient length of the respond data was less than three. Pearson correlation analysis among phytoplankton functional groups biomass, zooplankton functional groups biomass and physical-chemical variables was also conducted.
3 Results and discussion
3.1 Physical-chemical variables
Physical-chemical variables of lake water play a significant role in the distribution patterns and species composition of plankton (Mahar et al., 2000; Toma, 2011). In aquatic habitats, environmental variables such as dissolved gases, water temperature, pH, phosphates, nitrates, conductivity among many others including various physical properties (gases and solids solubility) are very important for growth and dispersal of phytoplankton on which zooplankton depend for their existence. In this study, all the physical-chemical variables measured in the Lake during the study period differed temporal (with the exception of pH). Water temperature (WT) which is one of the essential factors that regulates growth of plankton communities in aquatic system ranged between 5.79 ± 0.78 °C to 24.44 ± 0.99 °C. The minimum and maximum WT was recorded during October and July, respectively ( Tab. 1). Water temperature not only influences the growth and distribution of flora and fauna in aquatic ecosystems, but also influences solubility of gases, water stratification, conductivity and pH (Sharm and Michael, 1987). A possible increase in solar radiation and concomitant evaporation due to comparatively longer day length may explain higher water temperatures in the months of June, July and August. The recorded pH of lake varied between 8.84 ± 0.11 to 9.99 ± 0.22 during the study period (Tab. 1). The values showed that the water of Lake Hulun was alkaline in nature. Although the pH did not differ significantly temporal, relative high values were observed in July and August corresponding with high WT. This is in agreement with other studies that has observed elevated level of pH in the months of June, July and August (summer) likely because of high rate of photosynthesis in aquatic systems (Jakher and Rawat, 2003). The DO measured during the study period ranged from 7.07 ± 0.98 mg/L to 12.03 ± 0.50 mg/L. Unlike the WT, the minimum and maximum DO was observed in July and October. The minimum DO observed in July could be likely due to the utilization DO and decomposition of organic matter and respiration of micro and macro-organisms (Manickam et al., 2018). Water transparency (SD) values varied temporally with the lowest value observed in September (27.6 ± 10.75 cm) and the highest in July (42.4 ± 7.90 cm). The measured values of TP were in the range of 0.15 ± 0.13 mg/L to 0.20 ± 0.04 mg/L while those of TN varied between 1.10 ± 0.28 mg/L to 2.57 ± 0.07 mg/L. The measured TP and TN values in this study were lower than those reported by (Chuai et al., 2012) in 2009 and (Li et al., 2008) in 2008. Hay being flowed by wind to the lake from the Hunlunbier Grassland has been attributed as the most important source of these nutrients (Wang, 2006; Zhao et al., 2007).
Mean and standard error (number in brackets) for the physical–chemical variables in recorded during the study period in Lake Hulun.
3.2 Phytoplankton and zooplankton dynamics
During the study period, a total of 43 phytoplankton species were found belonging to seven taxonomic classes: Chlorophyceae, Bacillariophyceae, Cyanophyceae, Euglenophyceae, Chrysophyceae, Cryptophyceae, and Dinophyceae ( Tab. 2). The phytoplankton species were categorized in 23 functional groups as described by (Padisák et al., 2009; Reynolds, 2006; Reynolds et al., 2002). Four groups (H1, X2, J, and C) were categorized as dominant groups defined by contributing a minimum of 10% of the total biomass as recommended in literature (Reynolds et al., 2002). The remaining functional groups were clustered together as ‘others’. The four dominant groups accounted for about 81.33% of the total phytoplankton biomass hence used to analyze the composition and dynamics of phytoplankton community in Lake Hulun (Tab. 2). Temporal, the biomass of phytoplankton functional group C ranges from 0.05 mg/L to 0.16 mg/L. The highest mean biomass value was measured in June, followed by May and the least was observed in July ( Fig. 2). Higher biomass values of group H1 was measured in July (11.29 mg/L) and August (11.85mg/L) corresponding to higher WT. On the other hand, the biomass of group H1 was very low in May and October (Fig. 2) when WT was low. A post hock test showed that the biomass of group X2 was statistically significant higher biomass in August compared to that of other months.
For the zooplankton community dynamics, 27 species belonging to four taxonomic categories: protozoans, rotifers, copepods and cladocerans were observed in Lake Hulun ( Tab. 3). Rotifers had the highest number of species (11 species) followed by cladocerans with 6 species, whereas protozoans and copepods had 5 species each. The taxonomic categories were almost similar to those reported in Small Xingkai Wetland Lake by (Ma et al., 2019b) and by (Mwagona et al., 2018) in Xiquanyan Reservoir, Northeast China. The zooplankton species were classified into eight functional groups (Tab. 3). Approximately 40.02% of the total zooplankton functional group biomass contribution was of LCF while 21.60% was of RF group. SCF and MCC were the third and fourth most contributors of the total biomass with, 14.23% and 11.23%, respectively. The percentage biomass contribution for each of the other functional groups PF, RC, MCF, and LCC was less than 5%. The mean biomass of all zooplankton functional group differed significantly temporal as determined by one-way ANOVA (p < 0.05). Group LCF accounted for about 37.89%, 51.46%, 54.87% and 42.68% of the total biomass in June, July, September and October, respectively. In July, August and September, group RF accounted the second highest mean biomass ( Fig. 3) Group SCF had recoded higher biomass values of 1.75 mg/L and 2.54 mg/L in July and August. For the other months, the mean biomass contribution by group SCF was less than 0.05 mg/L. In August, group MCC had higher biomass mean value compared to the other months (Fig. 3).
List of phytoplankton species with their taxonomic, functional groups, and percentage contribution to their total biomass in Lake Hulun.
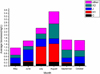 |
Fig. 2 Temporal variation of the biomass of phytoplankton functional groups in Lake Hulun. |
List of zooplankton species with their taxonomic, functional groups, and percentage contribution to their total biomass in Lake Hulun.
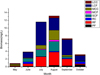 |
Fig. 3 Temporal variation of the biomass of zooplankton functional groups in Lake Hulun. |
3.3 Response of phytoplankton functional group variables to bottom-up and top-down effects
The relative importance of bottom-up versus top-down effects in aquatic ecosystems remains a longstanding and ongoing controversy. This question of whether the food webs are exerted by bottom-up or top-down trophic levels on lower ones and vice versa has long been the subject of scientific debate (Carpenter et al., 1985; Sinistro, 2010). Although both bottom-up or top-down forces are known to occur in aquatic systems, they may differ in magnitude. This study allowed the investigation of bottom-up and top-down effects on phytoplankton functional groups communities in freshwater lakes. Some studies carried out in lake has acknowledged that community biomass and productivity are controlled by the next higher trophic level (Shapiro et al., 1975). On the other hand, several authors revealed that nutrient loading explained a great amount of variation in phytoplankton biomass and production (Li et al., 2020; McCauley et al., 1989).
In this study we found that the effect of the bottom-up effects of physical-chemical variables on some phytoplankton functional groups was stronger than the top-down effects of zooplankton. This is in agreement with other studies in the literature. For example, while exploring the bottom-up and top-down effects on phytoplankton communities in two freshwater lakes (Li et al., 2020) observed that the effect of bottom-up (physical-chemical variables) on phytoplankton were stronger that the effects of top-down (predation by zooplankton). Phytoplankton functional group X2 which constitutes about 21.06% of the total biomass of the phytoplankton represented by Chlamydomonas ovalis and Chlamydomonas globosa species was mainly influenced by TP, Cond, SD and WT ( Fig. 4 and Tab. 4). Similarly, as shown in RDA and Pearson correlation analysis (Fig. 4 and Tab. 4), Anabaena circinalis, Anabaena variabilis, and Aphanizomenon flos-Aquae which composed group H1 and also known to cause bloom in Lake Hulun were also strongly influenced by physical-chemical variables (WT, TN, Cond, and SD). Studies have shown that chemical variables such as N and P influence the growth and reproduction of phytoplankton in water (Elliott et al., 2006; Xu et al., 2010). While using the phytoplankton community model, PROTECH, to examine the effects of elevated temperature and nutrients loading on phytoplankton productivity and succession (Elliott et al., 2006) observed phytoplankton biomass increase with increase in temperature and nutrients loading. These authors further noted that the increased phytoplankton biomass was largely dominated by the cyanobacterium Anabaena. This is in agreement with our finding since the group H1 composed by the Anabaena species was positive influenced by WT and TN. The fact that the biomass of group H1 and X2 were higher in July and August when the WT was high also signifies the importance of temperature. The rate of photosynthesis of phytoplankton is probably promoted by the rising WT, which accelerates the accumulation of biomass. Nutrients such as N and P are important for the growth of phytoplankton, and at particular concentrations can influence the growth of phytoplankton (Elmgren and Larsson, 2001). Sun et al. (2008) note that increase concentrations of N and P at a given range can promote the growth of phytoplankton. This, therefore implies that nutrients factors in lakes can effectively control the biomass of phytoplankton functional groups through bottom-up effects.
A significant positive correlation between DO and some phytoplankton biomass in this study was observed (Tab. 4). This observation could be due to the fact that oxygen is produced during photosynthesis. Therefore an increase in phytoplankton biomass comes with a resultant increase in DO concentration. On the other hand, a significant negative correlation between SD and the biomass of some phytoplankton functional group was observed. This is very strange because increased SD increases the intensity of solar radiation that can be captured by phytoplankton, hence increased photosynthesis and other metabolic activities with a subsequent increase in population density and biomass of phytoplankton (Ma et al., 2019a; Yusuf, 2020). Napiórkowska-Krzebietke et al. (2013) also observed that phytoplankton biomass and chlorophyll concentration in water were relatively low (typical of mesotrophic lakes), with a decreasing tendency when the water transparency significantly increased.
Conversely, our results showed that the biomass of most phytoplankton functional groups was negatively affected by conductivity (Tab. 4). Conductivity, a measure of a solution's conductive abilities and thus the total dissolved solids within the solution, can affect the ecological viability of freshwater lakes such as Lake Hulun. Conductivity may also affect P availability in the water column by allowing anion binding to P in the form of phosphate, resulting in a decreased concentration of total available P. Since P is a critical nutrient for phytoplankton growth, it is possible that this chemical interaction would prevent phytoplankton from accessing P, resulting in decreased phytoplankton biomass (Chouyyok et al., 2010). This could explain the negative effect of conductivity on phytoplankton biomass observed in this study.
Some experimental and modeling studies have shown that top-down factors are most important in determining phytoplankton biomass, concentration of chlorophyll a, and phytoplankton size-distribution, either directly through grazing or indirectly through increased nutrient supply by excretion (Hansson, 1992; Mao et al., 2020; Metaxas and Scheibling, 1996). McQueen et al. (1986) showed that although phytoplankton production is determined mainly by nutrients, the effect of predation by zooplankton is dependent on the size of the zooplankton. In this study, zooplankton functional group RF (Rotifer passive filter feeders feeding on organic detritus and bacteria) (Mwagona et al., 2018) was positively correlated with phytoplankton group C and H1 ( Tab. 5). This observation could be attributed by the fact that RF grazed predominantly on heterotrophic components of the microbial food-web, such as bacteria, fungus and detritus which have been documented to be favored by occurrence of higher concentrations of nutrients (TP and TN) (Duggan et al., 2001; Holst et al., 1998). Zooplankton may also enhance the biomass and abundance of some phytoplankton groups by selectively feeding on their potential competitors (Vanni and Findlay, 1990). Moreover, the fact that most zooplankton functional groups were positively related with the phytoplankton biomass in this study could imply that the top-down control of phytoplankton by the zooplankton in Lake Hulun is not strong enough to produce negative effect. Another possible explanation could be that the grazers (zooplanktons) may have beneficial effects for certain phytoplankton functional groups by increasing nutrients concentration through excretion (Metaxas and Scheibling, 1996; Smith and Lancelot, 2004).
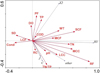 |
Fig. 4 Redundancy analysis (RDA) plots for different phytoplankton functional group biomass, zooplankton functional group biomass and water physical chemical variable parameters in Lake Hulun. |
The Pearson correlations between physical chemical variables and phytoplankton functional groups in Lake Hulun.
The Pearson correlations between phytoplankton functional groups and zooplankton functional groups in Lake Hulun.
4 Conclusions
In this study we found that the effect of the bottom-up effects of physical-chemical variables on some phytoplankton functional groups was stronger than the top-down effects of zooplankton. Of the physical-chemical variables measured in this study, WT, TP, TN, Cond, SD, and DO had significant influence on the biomass of phytoplankton functional groups. Phytoplankton functional group X2 and H1 which constitutes about 47.08% of the total biomass of the phytoplankton were mainly influenced positively by nutrients availability (TP and TN). This is because variables such as N and P influence the growth and reproduction of phytoplankton in water. Moreover, WT and DO had a positive influence on the biomass of phytoplankton functional groups. Also, in this study, phytoplankton biomass revealed a decreasing tendency when the SD and Cond significantly increased.
While the bottom-up effects of physical-chemical variables on phytoplankton are clear, the top-down effects of zooplankton on phytoplankton, which may have been regulated indirectly by fish, are more difficult to predict in aquatic management. This study showed that zooplankton functional groups were positively correlated with phytoplankton biomass implying that the top-down control of phytoplankton by the zooplankton in Lake Hulun is not strong enough to produce a negative effect. Even though our study may not be conclusive as such, it is quite clear that the zooplankton functional groups in Lake Hulun are controlled more by bottom-up force than top-down force. However, these conclusions should be drawn cautiously because more data is needed for a thorough analysis of the two effects. These results can serve as a basis for identifying how phytoplankton dynamics are influenced, which have implications for developing sustainable management strategies and conserving services of Lake Hulun and other eutrophic fresh water lakes.
Conflict of interest
The authors declare no conflict of interest.
Acknowledgements
We wish to acknowledge the financial support from the Fundamental Research Funds for the Central Universities (2572018BE03) and National Key Research and Development Program of China (Grant No.2016YFC0500406).
References
- Benedetti F, Gasparini S, Ayata S-D. 2015. Identifying copepod functional groups from species functional traits. J Plankton Res 38: 159–166. [CrossRef] [PubMed] [Google Scholar]
- Benedetti F, Vogt M, Righetti D, Guilhaumon F, Ayata SD. 2018. Do functional groups of planktonic copepods differ in their ecological niches? J Biogeogr 45: 604–616. [CrossRef] [Google Scholar]
- Cadotte MW, Carscadden K, Mirotchnick N. 2011. Beyond species: functional diversity and the maintenance of ecological processes and services. J Appl Ecol 48: 1079–1087. [CrossRef] [Google Scholar]
- Carignan R, Neiff JJ. 1992. Nutrient dynamics in the floodplain ponds of the Paraná River (Argentina) dominated by the water hyacinth Eichhornia crassipes . Biogeochemistry 17: 85–121. [CrossRef] [Google Scholar]
- Carpenter SR, Kitchell JF, Hodgson JR. 1985. Cascading trophic interactions and lake productivity. BioScience 35: 634–639. [CrossRef] [Google Scholar]
- Chen Q, Zhang S, Zhu C. 1974. On planktonic copepods of the yellow Sea and the East China Sea. II. Cyclopoida and Harpacticoida. Stud Marina Sin 9: 24. [Google Scholar]
- Chouyyok W, Wiacek RJ, Pattamakomsan K, Sangvanich T, Grudzien RM, Fryxell GE, Yantasee W. 2010. Phosphate removal by anion binding on functionalized nanoporous sorbents. Environ Sci Technol 44: 3073–3078. [CrossRef] [Google Scholar]
- Chuai X-M., Chen X, Yang L, Zeng J, Miao A, Zhao H. 2012. Effects of climatic changes and anthropogenic activities on lake eutrophication in different ecoregions. Int J Environ Sci Technol 9: 503–514. [CrossRef] [Google Scholar]
- Doi H, Chang K-H., Nishibe Y, Imai H, Nakano S-i. 2013. Lack of congruence in species diversity indices and community structures of planktonic groups based on local environmental factors. PLoS One 8. [Google Scholar]
- dos Santos Severiano J, do Nascimento Moura A, dos Santos Almeida VL. 2012. Study about top-down and bottom-up controls in regulating the phytoplankton biomass in a eutrophic reservoir in northeastern Brazil. J Water Resour Protect 4: 616. [CrossRef] [Google Scholar]
- Duggan I, Green J, Shiel R. 2001. Distribution of rotifers in North Island, New Zealand, and their potential use as bioindicators of lake trophic state. In: Rotifera IX. Springer, pp 155–164. [CrossRef] [Google Scholar]
- Elliott J, Jones I, Thackeray S. 2006. Testing the sensitivity of phytoplankton communities to changes in water temperature and nutrient load, in a temperate lake. Hydrobiologia 559: 401–411. [CrossRef] [Google Scholar]
- Elmgren R, Larsson U. 2001. Nitrogen and the Baltic Sea: managing nitrogen in relation to phosphorus. Sci World J 1. [Google Scholar]
- Haney J, et al. 2013. An image-based key to the zooplankton of North America University of New Hampshire Center for Freshwater Biology. [Google Scholar]
- Hansson L-A. 1992. The role of food chain composition and nutrient availability in shaping algal biomass development. Ecology 73: 241–247. [CrossRef] [Google Scholar]
- Holst H, Zimmermann H, Kausch H, Koste W. 1998. Temporal and spatial dynamics of planktonic rotifers in the Elbe Estuary during spring. Estuarine Coastal Shelf Sci 47: 261–273. [CrossRef] [Google Scholar]
- Hongjun S, Xuelei Z, Baodong W, Xia S, Xiao W, Ming X. 2014. Bottom-up and top-down controls of the phytoplankton standing stock off the Changjiang Estuary. Haiyang Xuebao ( in Chinese) 36: 91–100. [Google Scholar]
- Hu H. 2006. The freshwater algae of China: systematics, taxonomy and ecology. Science Press. [Google Scholar]
- Jakher G, Rawat M. 2003. Studies on physico-chemical parameters of a tropical lake, Jodhpur, Rajasthan. India. J Aquat Biol 18: 79–83. [Google Scholar]
- Ke Z, Xie P, Guo L. 2008. Controlling factors of spring-summer phytoplankton succession in Lake Taihu (Meiliang Bay, China). Hydrobiologia 607: 41–49. [CrossRef] [Google Scholar]
- Kotov A, Forró L, Korovchinsky N, Petrusek A. 2013. World checklist of freshwater Cladocera species. World Wide Web electronic publication 38. [Google Scholar]
- Li S, Chen J, Xiang J, Pan Y, Huang Z, Wu Y. 2019. Water level changes of Hulun Lake in Inner Mongolia derived from Jason satellite data. J Vis Commun Image Represent 58: 565–575. [CrossRef] [Google Scholar]
- Li Y, Meng J, Zhang C, Ji S, Kong Q, Wang R, Liu J. 2020. Bottom-up and top-down effects on phytoplankton communities in two freshwater lakes. PLoS One 15: e0231357. [CrossRef] [Google Scholar]
- Li Z, Zhang Z, Jiang F, Wang S, Wang F. 2008. Lake Hulun Chi (continuous Chi two). Nimenggu: Neimenggu Culture Press. [Google Scholar]
- Liu C, Liu L, Shen H. 2010. Seasonal variations of phytoplankton community structure in relation to physico-chemical factors in Lake Baiyangdian, China. Proc Environ Sci 2: 1622–1631. [CrossRef] [Google Scholar]
- Ma C, Chula Mwagona P, Yu H, Sun X, Liang L, Al-Ghanim K, Mahboob S. 2019a. Spatial and temporal variation of phytoplankton functional groups in extremely alkaline Dali Nur Lake, North China. J Freshw Ecol 34: 91–105. [CrossRef] [Google Scholar]
- Ma C, Mwagona PC, Yu H, Sun X, Liang L, Mahboob S, Al-Ghanim KA. 2019b. Seasonal dynamics of zooplankton functional group and its relationship with physico-chemical variables in high turbid nutrient-rich Small Xingkai Wetland Lake, Northeast China. J Freshw Ecol 34: 65–79. [CrossRef] [Google Scholar]
- Mahar M, Baloch W, Jafri S. 2000. Diversity and seasonal occurrence of planktonic rotifers in Manchar Lake, Sindh, Pakistan. Pakistan J. Fish. [Google Scholar]
- Manickam N, et al. 2018. Impact of seasonal changes in zooplankton biodiversity in Ukkadam Lake, Coimbatore, Tamil Nadu, India, and potential future implications of climate change. J Basic Appl Zool 79: 15. [CrossRef] [Google Scholar]
- Mao Z, et al. 2020. The role of top-down and bottom-up control for phytoplankton in a subtropical shallow eutrophic lake: evidence based on long-term monitoring and modeling. Ecosystems 1–15. [Google Scholar]
- McCauley E, Downing JA, Watson S. 1989. Sigmoid relationships between nutrients and chlorophyll among lakes. Can J Fish Aquat Sci 46: 1171–1175. [CrossRef] [Google Scholar]
- McQueen DJ, Post JR, Mills EL. 1986. Trophic relationships in freshwater pelagic ecosystems. Can J Fish Aquat Sci 43: 1571–1581. [CrossRef] [Google Scholar]
- MEP (Ministry of Environmental Protection C. 2002. China's national standard: GB3838-2002: Environmental quality standards for surface water. [Google Scholar]
- Metaxas A, Scheibling RE. 1996. Top-down and bottom-up regulation of phytoplankton assemblages in tidepools. Mar Ecol Progr Ser 145: 161–177. [CrossRef] [Google Scholar]
- Mwagona PC, Chengxue M, Hongxian Y. 2018. Seasonal dynamics of Zooplankton functional groups in relation to environmental variables in Xiquanyan Reservoir, Northeast China. Ann Limnol 33. [CrossRef] [Google Scholar]
- Napiórkowska-Krzebietke A, Stawecki K, Pyka JP, Hutorowicz J, Zdanowski B. 2013. Phytoplankton in relation to water quality of a mesotrophic lake. Pol J Environ Stud 22. [Google Scholar]
- Nicolle A, Hansson L-A., Brodersen J, Nilsson PA, Brönmark C. 2011. Interactions between predation and resources shape zooplankton population dynamics. PLoS One 6. [Google Scholar]
- Padisák J, Crossetti LO, Naselli-Flores L. 2009. Use and misuse in the application of the phytoplankton functional classification: a critical review with updates. Hydrobiologia 621: 1–19. [Google Scholar]
- Reynolds CS. 2006. The ecology of phytoplankton. Cambridge University Press. [CrossRef] [Google Scholar]
- Reynolds CS, Huszar V, Kruk C, Naselli-Flores L, Melo S. 2002. Towards a functional classification of the freshwater phytoplankton. J Plankton Res 24: 417–428. [Google Scholar]
- Shapiro J, Lamarra V, Lynch M. 1975. Biomanipulation: an ecosystem approach to lake restoration Limnology Research Centre, University of Minnesota 143: 1–32. [Google Scholar]
- Sharm B, Michael RG. 1987. Review of taxonomic studies on freshwater Cladocera from India with remarks on biogeography. In: Cladocera. Springer, pp. 29–33. [CrossRef] [Google Scholar]
- Sinistro R. 2010. Top-down and bottom-up regulation of planktonic communities in a warm temperate wetland. J Plankton Res 32: 209–220. [CrossRef] [Google Scholar]
- Sinistro R, Sánchez ML, Marinone MC, Izaguirre I. 2007. Experimental study of the zooplankton impact on the trophic structure of phytoplankton and the microbial assemblages in a temperate wetland (Argentina). Limnologica 37: 88–99. [CrossRef] [Google Scholar]
- Smith WO, Lancelot C. 2004. Bottom-up versus top-down control in phytoplankton of the Southern Ocean Antarctic. Science 16: 531–539. [Google Scholar]
- Statsoft I. 1995. Statistica for Windows (Computer program manual) Tulsa, USA. [Google Scholar]
- Sun S, Huo Y, Yang B. 2010. Zooplankton functional groups on the continental shelf of the yellow sea. Deep Sea Res II 57: 1006–1016. [CrossRef] [Google Scholar]
- Sun X, Dong S, Tang Z. 2008. Influences of nutrients and illuminace on phytoplankton community structure South China. Fish Sci 4: 5–13. [Google Scholar]
- Toma JJ. 2011. Physical and chemical properties and algal composition of Derbendikhan lake, Sulaimania, Iraq. Curr World Environ 6: 17. [Google Scholar]
- Vallina SM, Cermeno P, Dutkiewicz S, Loreau M, Montoya JM. 2017. Phytoplankton functional diversity increases ecosystem productivity and stability. Ecol Model 361: 184–196. [CrossRef] [Google Scholar]
- Vanni MJ, Findlay DL. 1990. Trophic cascades and phytoplankton community structure. Ecology 71: 921–937. [CrossRef] [Google Scholar]
- Wang L. 2006. Analysis on the aquatic environment and water quality condition of Lake Hulun. J Hulunbeier Coll 14: 5–7. [Google Scholar]
- White TC. 1978. The importance of a relative shortage of food in animal ecology. Oecologia 33: 71–86. [CrossRef] [PubMed] [Google Scholar]
- Xu H, Paerl HW, Qin B, Zhu G, Gaoa G. 2010. Nitrogen and phosphorus inputs control phytoplankton growth in eutrophic Lake Taihu, China. Limnol Oceanogr 55: 420–432. [Google Scholar]
- Yusuf ZH. 2020. Phytoplankton as bioindicators of water quality in Nasarawa reservoir, Katsina State Nigeria. Acta Limnol Bras 32. [Google Scholar]
- Zhao H, Li C, Zhao H, Tian H, Song Q, Kou Z-q. 2007. The climate change and its effect on the water environment in the Hulun Lake Wetland. J Glaciol Geocryol 29: 795–801. [Google Scholar]
Cite this article as: Ma C, Zhao C, Mwagona PC, Li Z, Liu Z, Dou H, Zhou X, Bhadha JH. 2021. Bottom-up and top-down effects on phytoplankton functional groups in Hulun Lake, China. Ann. Limnol. - Int. J. Lim. 57: 3
All Tables
Mean and standard error (number in brackets) for the physical–chemical variables in recorded during the study period in Lake Hulun.
List of phytoplankton species with their taxonomic, functional groups, and percentage contribution to their total biomass in Lake Hulun.
List of zooplankton species with their taxonomic, functional groups, and percentage contribution to their total biomass in Lake Hulun.
The Pearson correlations between physical chemical variables and phytoplankton functional groups in Lake Hulun.
The Pearson correlations between phytoplankton functional groups and zooplankton functional groups in Lake Hulun.
All Figures
|
Fig. 1 (Top) Map of Hulun Lake drainage basin; (bottom) ten sampling locations within Lake Hulun and surrounding drainage area in Heilongjiang, China. |
| In the text | |
|
Fig. 2 Temporal variation of the biomass of phytoplankton functional groups in Lake Hulun. |
| In the text | |
|
Fig. 3 Temporal variation of the biomass of zooplankton functional groups in Lake Hulun. |
| In the text | |
|
Fig. 4 Redundancy analysis (RDA) plots for different phytoplankton functional group biomass, zooplankton functional group biomass and water physical chemical variable parameters in Lake Hulun. |
| In the text | |
Current usage metrics show cumulative count of Article Views (full-text article views including HTML views, PDF and ePub downloads, according to the available data) and Abstracts Views on Vision4Press platform.
Data correspond to usage on the plateform after 2015. The current usage metrics is available 48-96 hours after online publication and is updated daily on week days.
Initial download of the metrics may take a while.