Fig. 2
Download original image
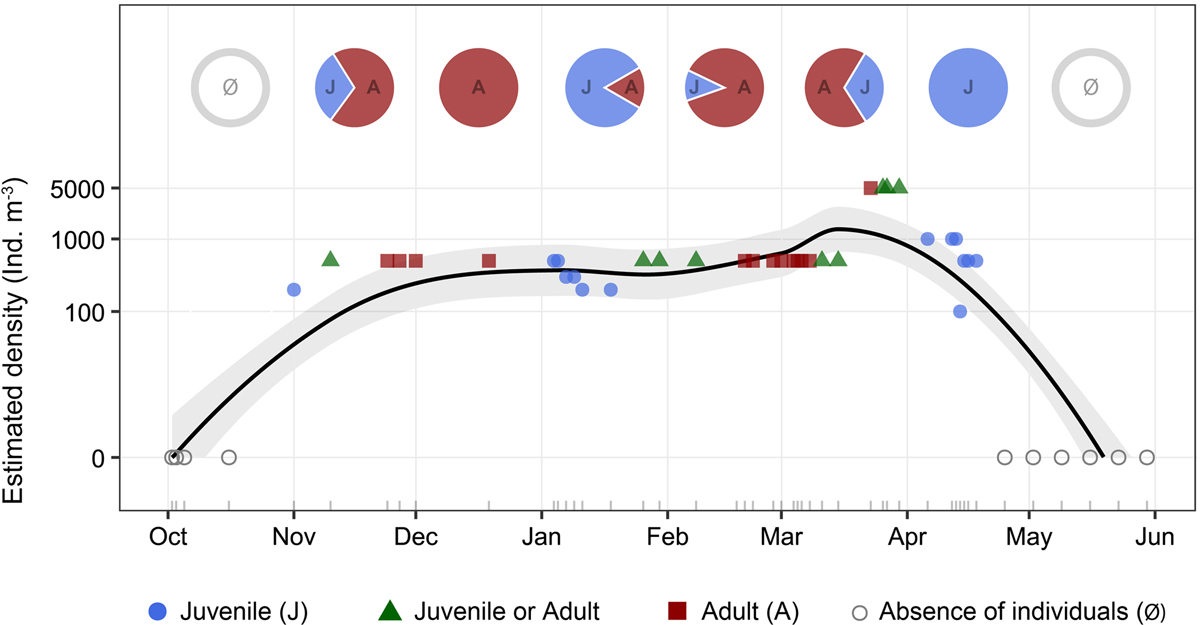
Seasonal dynamics of Hemimysis anomala estimated density (ind. m−3) from winter 2021 to summer 2022, based on diving observations of the swarm located in the reference concrete pipe (1.4 m3). Points represent individual observations, distinguished by life stage (blue circles = Juvenile, green triangles = Juvenile or Adult, red squares = Adult) and by absence of individuals (open grey circles, i.e., no mysids detected). The black line and grey shaded area show a loess smoother with its 95% confidence interval. The y-axis is shown on a logarithmic scale. Inset pie charts above each month summarize the proportion of juveniles (J) and adults (A) (weighted by total individuals observed across dives).
Current usage metrics show cumulative count of Article Views (full-text article views including HTML views, PDF and ePub downloads, according to the available data) and Abstracts Views on Vision4Press platform.
Data correspond to usage on the plateform after 2015. The current usage metrics is available 48-96 hours after online publication and is updated daily on week days.
Initial download of the metrics may take a while.