Fig. 2

Download original image
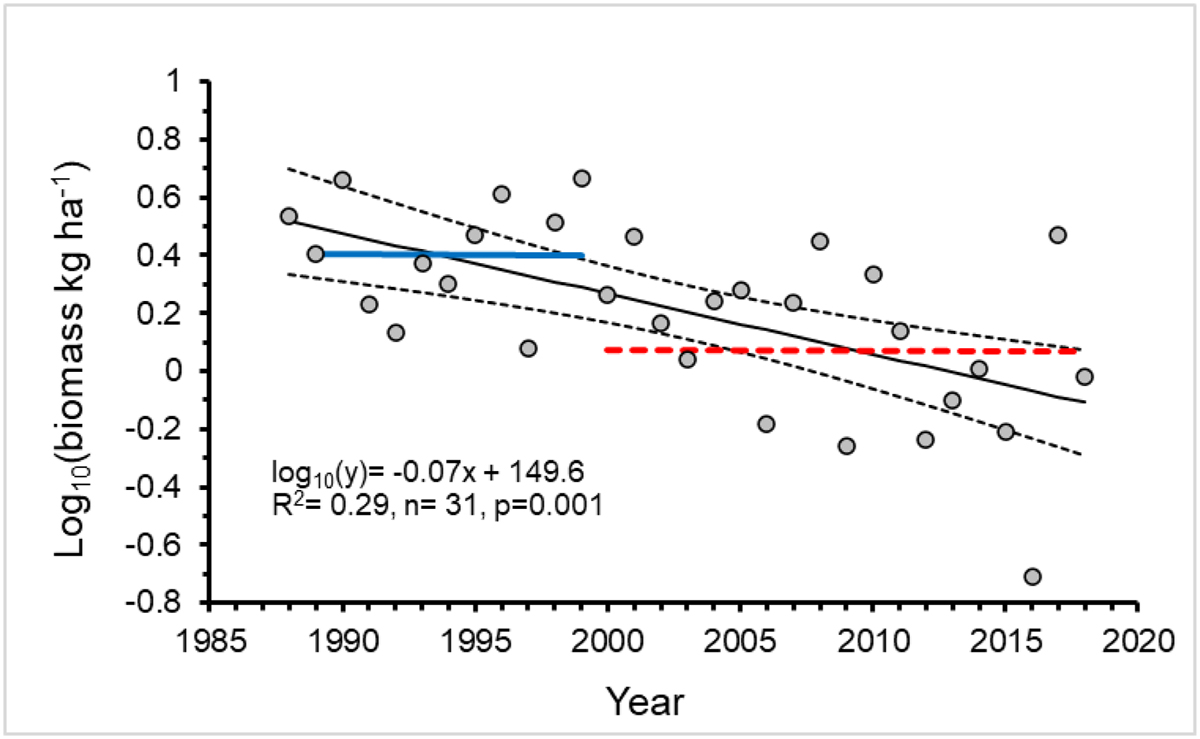
Total whitefish population biomass in autumn in 1988–2018. Horizontal lines indicate the average biomass during the period of overfishing of vendace in 1989–1999 (blue), and after the vendace recovery in 2000–2018 (red dashed). The oblique trendline (black) indicates the general declining trend of whitefish biomass. The 95% confidence intervals are shown (dashed curves).
Current usage metrics show cumulative count of Article Views (full-text article views including HTML views, PDF and ePub downloads, according to the available data) and Abstracts Views on Vision4Press platform.
Data correspond to usage on the plateform after 2015. The current usage metrics is available 48-96 hours after online publication and is updated daily on week days.
Initial download of the metrics may take a while.


