Free Access
Table 4
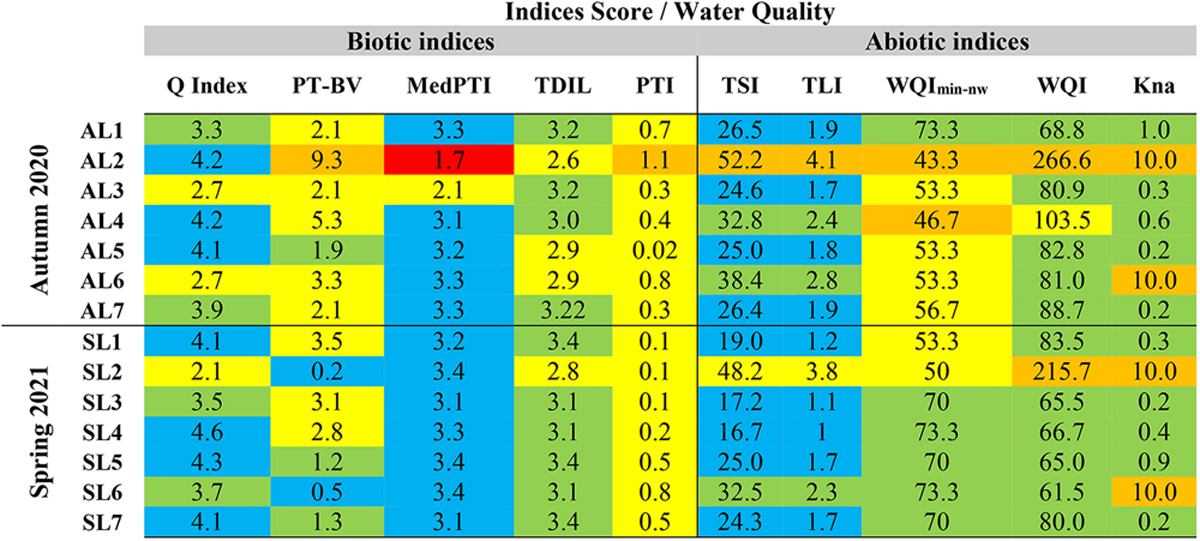
Ecological status of the seven sites (lakes) according to various biotic and abiotic indices. The meaning of different colors used in the table is as follows: blue − high quality, green − good quality, yellow − moderate quality, orange − poor quality, red − bad quality.
Current usage metrics show cumulative count of Article Views (full-text article views including HTML views, PDF and ePub downloads, according to the available data) and Abstracts Views on Vision4Press platform.
Data correspond to usage on the plateform after 2015. The current usage metrics is available 48-96 hours after online publication and is updated daily on week days.
Initial download of the metrics may take a while.