Fig. 2
Download original image
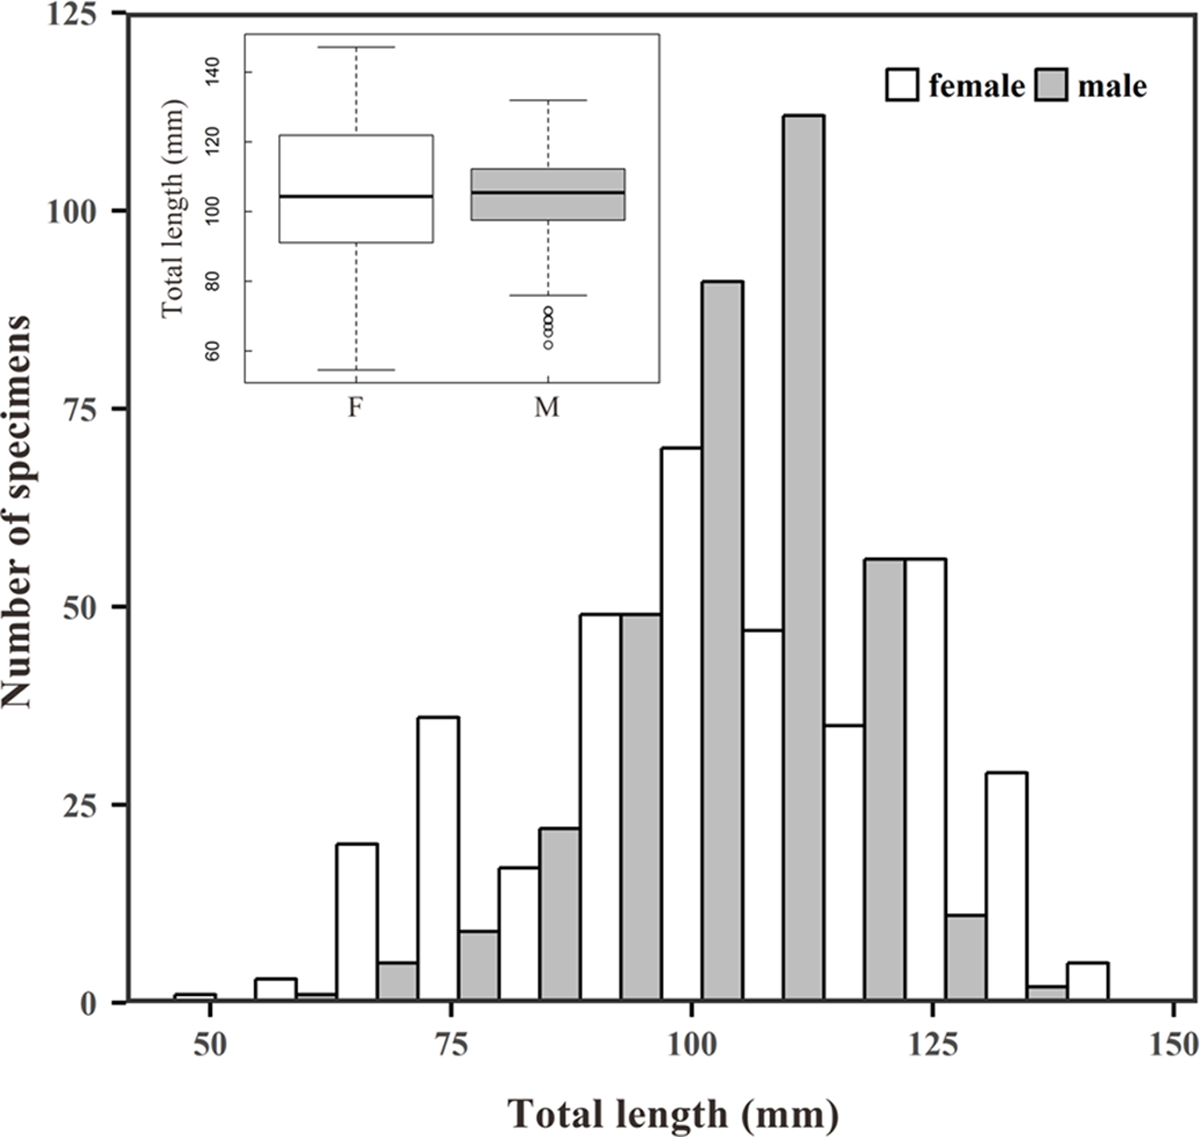
Length frequency distributions of female (white) and male (gray) Toxabramis swinhonis collected in BDT Lake from October 2016 to September 2017. Histograms and boxplots (horizontal line within box: median; boundaries of box: 25% and 75% quantiles; bars: lower and upper inner fences; circles: outliers) are two different approaches used to characterize this information.
Current usage metrics show cumulative count of Article Views (full-text article views including HTML views, PDF and ePub downloads, according to the available data) and Abstracts Views on Vision4Press platform.
Data correspond to usage on the plateform after 2015. The current usage metrics is available 48-96 hours after online publication and is updated daily on week days.
Initial download of the metrics may take a while.