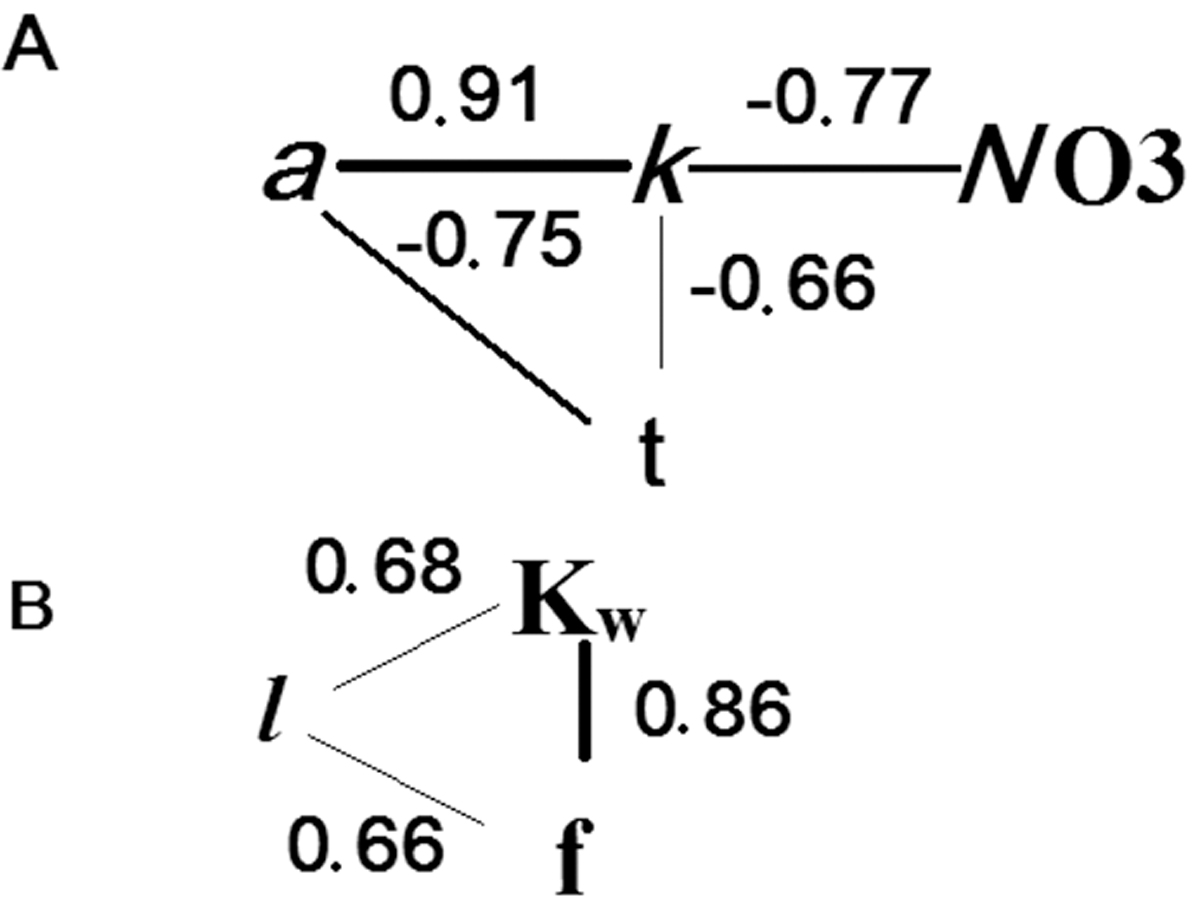
Fig. 4

Download original image
Graph showing paired connections for pigment content (а: chlorophyll a, k: carotenoids), nitrate concentration and abiotic variables (t: air temperature; l: water level; f: total precipitation; Kw: water exchange coefficient). (A): system of connections for pigment content; (B): system of connections for precipitation levels and hydrological variables. Line thickness indicates connection strength. The graph was plotted using only those connections that have statistically significant Pearson's correlation coefficients of more than 0.60 (shown above the lines).
Current usage metrics show cumulative count of Article Views (full-text article views including HTML views, PDF and ePub downloads, according to the available data) and Abstracts Views on Vision4Press platform.
Data correspond to usage on the plateform after 2015. The current usage metrics is available 48-96 hours after online publication and is updated daily on week days.
Initial download of the metrics may take a while.


