Fig. 1
Download original image
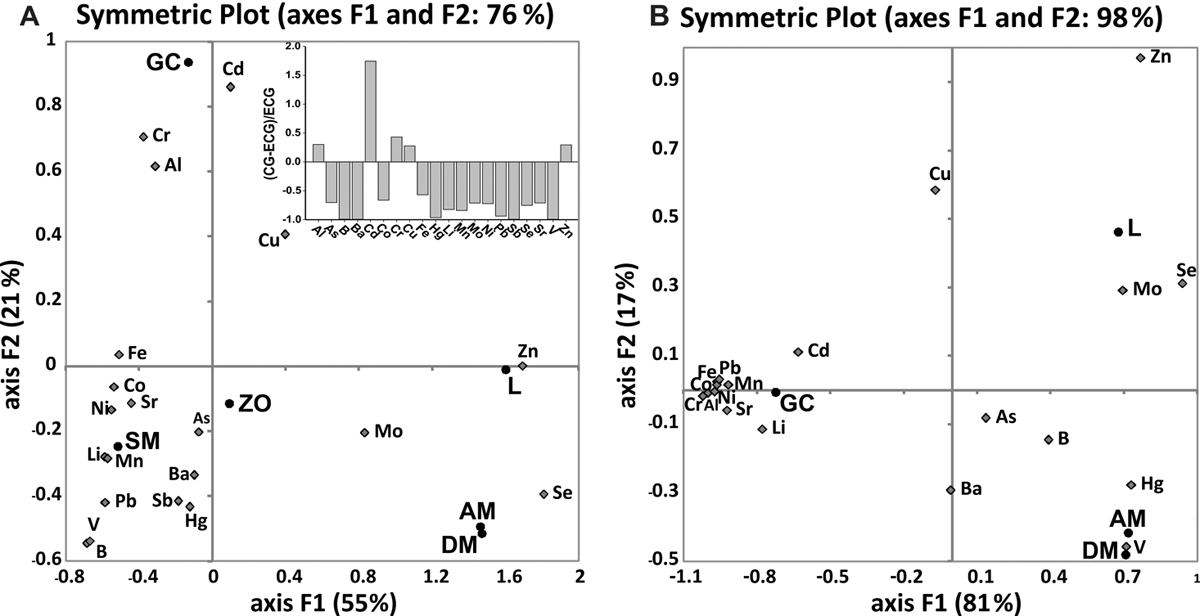
(A) The CA biplot showing relationships between carp tissues, dorsal (DM) and abdominal (AM) muscle and liver (L), fish gut content (GC), zooplankton (ZO) and fish pond sediment (SM) based on their element concentrations. Inset: the deviation of the measured element concentrations in GC from the expected ones (EGC). (B) The CA biplot showing relationships between carp tissues (dorsal and abdominal muscle and liver), and gut content.
Current usage metrics show cumulative count of Article Views (full-text article views including HTML views, PDF and ePub downloads, according to the available data) and Abstracts Views on Vision4Press platform.
Data correspond to usage on the plateform after 2015. The current usage metrics is available 48-96 hours after online publication and is updated daily on week days.
Initial download of the metrics may take a while.