


| Issue |
Int. J. Lim.
Volume 62, 2026
|
|
|---|---|---|
| Article Number | 8 | |
| Number of page(s) | 6 | |
| DOI | https://doi.org/10.1051/limn/2026006 | |
| Published online | 07 July 2026 | |
Research article
Modeling the dynamics of PMMoV, a sewage-associated virus in the Seine River across Paris
1
Univ Rennes, CNRS, ECOBIO, UMR 6553, 35000 Rennes, France
2
Univ Rennes, IRMAR, UMR 6625, 35000 Rennes, France
3
SIAAP, Innovation Department, 82 Avenue Kleber, 92700 Colombes, France
* Corresponding author: This email address is being protected from spambots. You need JavaScript enabled to view it.
Received:
8
September
2025
Accepted:
21
May
2026
Abstract
Assessing the water quality of bathing waters is possible by monitoring bioindicator organisms such as microorganisms. As the most abundant biological entities in water bodies, viruses have shown potential to reflect anthropogenic contamination. In this context, this project aimed to investigate the temporal and spatial dynamics of one specific sewage-associated virus in the Seine River: the pepper mild mottle virus (PMMoV). We developed a system of partial differential equations to model the transport and longitudinal evolution of viral concentrations as a function of river flow. The proposed model successfully reproduced and explained the upstream increase of PMMoV in the studied Parisian section of the Seine River and could be applied to other methods of virus enumeration, other viruses or other rivers.
Key words: Viral persistence / fluvial modeling / fecal indicator organisms / PMMoV
© A. Langlais et al., published by EDP Sciences, 2026
 This is an Open Access article distributed under the terms of the Creative Commons Attribution License (https://creativecommons.org/licenses/by/4.0), which permits unrestricted use, distribution, and reproduction in any medium, provided the original work is properly cited.
1 Introduction
In light of new lifestyles and new challenges posed by climate change, bathing water quality is becoming a major issue. This is particularly true for the Seine River, which notably hosted several swimming events during the 2024 summer Olympic and Paralympic Games. These events highlighted how unpredictable the water quality of the Seine River can be and how difficult it is to monitor. In Europe, bathing water is considered safe if the concentration of two fecal indicator bacteria (FIB), Escherichia coli and intestinal enterococci, does not exceed regulatory thresholds (European Directive 2006/7/EC). These organisms are used to assess microbiological quality. Although many studies have reported high abundances of diverse viral populations in aquatic environments (Farrell et al., 2021), viruses have not yet been incorporated into official microbiological quality standards. While FIBs are efficient to describe fecal contamination, they do not correlate well with the presence of viruses (pathogenic or not) and have limited capacity to identify the source of pollution (Prevost et al., 2015; Farrell et al., 2021).
Since the Covid-19 outbreak, viruses have received increased attention from wastewater stakeholders of the Seine River, notably following the detection of SARS-CoV-2 in wastewater or sludges (Wurtzer et al., 2020; Guérin-Rechdaoui et al., 2022; Viveros et al., 2022). Although many research groups have investigated viral indicators (Andrianjakarivony et al., 2023), few have developed a more comprehensive view of virus ecology in fluvial systems via modeling approaches (Peduzzi, 2016).
Models describing the persistence of pathogens in aquatic environments already exist and can be adapted to viruses (Mitchell and Akram, 2017). Since most enteric viruses and host-specific bacteriophages do not actively replicate in the aquatic environment in the absence of their specific hosts, their concentrations in the water column generally decrease as a result of biological, physical, and chemical processes (Vasickova and Kovarcik, 2013). Viral concentrations can, therefore, be described mathematically, taking into account both a decay rate and their transport in the water flow.
Since July 2021, the concentration of PMMoV has been determined at two sites along the Seine River, upstream and downstream of Paris, along with measurements of physico-chemical and hydrological parameters. Our aim was to describe the dynamics of a sewage-associated virus in the Parisian section of the Seine River by modeling virus concentrations based on three years of data from these sampling sites. The selected virus is a sewage-associated marker: the plant pathogen pepper mild mottle virus (PMMoV). Previous studies (Zhang et al., 2006; Rosario et al., 2009) reported high concentrations of PMMoV in human fecal and wastewater samples, suggesting its potential as a highly abundant indicator of fecal pollution. Mathematical modeling was applied to explain the differences in viral concentrations observed in the Seine River upstream and downstream of Paris. This study proposes a first modeling effort to describe virus dynamics over time and space in a highly anthropized river system. Although applied here to the Seine River, the underlying framework relies on generic transport and decay processes and could be extended to other river systems. Furthermore, we used concentrations of viruses obtained by digital PCR, considering only genome persistence and not virulence, but the model is adaptable to any other viruses or types of measurements.
2 Materials and methods
2.1 Study sites and sampling campaigns
This study concerns the Seine River in the Greater Paris region, including two tributaries: the Marne and Oise Rivers and one stormwater overflow structure at Clichy. This section of the Seine River also receives outflow from six wastewater treatment plants (WWTP): Seine Valenton (SEV), Marne Aval (MAV), Seine Morée (SEM), Seine Centre (SEC), Seine Aval (SAV), and Seine Grésillons (SEG), all representing potential point sources of virus contamination (Fig. 1). From July 2021 to July 2024, 1 L of the surface water column of the Seine River was sampled each month by the Parisian operator in charge of wastewater treatment (the Greater Paris Sanitation Authority, SIAAP). The sampling was carried out at a near-surface level using a bucket, which was rinsed beforehand, from the bridge along the central axis of the river. There were two study sites: one upstream of Paris at Choisy-le-Roi (then called Choisy) (48°45'59.0′N 2°24′43.9′E) and one downstream of Paris at Triel-sur-Seine (then called Triel) (48°58'42.7′N 2°00′05.1′E). In addition, at the same frequency, 1 L of sewage water was sampled at Clichy (48°54′21.6′N 2°17′48.1′E). The samples collected were stored in refrigerated coolers and then in a refrigerator, protected from light at 4°C.
 |
Fig. 1 Map of the Seine River in the studied Paris region, including the three virus measurement sites (Choisy-le-Roi, Triel-sur-Seine for river freshwater, and Clichy for sewage water; white circles) and the corresponding river flow stations (Alfortville, Poissy, and Austerlitz; black triangles). The Seine River in the studied region is segmented into four parts by black lines, corresponding to the four studied sections (highlighted), taking into account the two tributaries (Marne and Oise rivers) and the stormwater overflow structure at Clichy. The six wastewater treatment plants are represented: Seine Valenton (SEV), Marne Aval (MAV), Seine Morée (SEM), Seine Centre (SEC), Seine Aval (SAV), and Seine Grésillons (SEG). |
2.2 Hydrological parameters
River flow values were collected on Hydroportail1 (30/06/2024). These were daily measurements taken upstream of Paris (Alfortville) and in Paris (Austerlitz), or calculations based on water velocities downstream of Paris (Poissy). Flow rates at Alfortville and Poissy are similar to those at Choisy and Triel, respectively. These ranged from 46.1 m3 s−1 to 906 m3 s−1 at Alfortville, from 74.5 m3 s−1 to 1026 m3 s−1 at Austerlitz, and from 528 m3 s−1 to 1250 m3 s−1 at Poissy.
2.3 Virus concentration determination
In order to detect the virus, water samples were submitted to ultrafiltration and nucleic acid extraction before being enumerated by digital PCR. All this was performed by the IAGE company (Montpellier, France) following the patented method WO2022/144432, dedicated to pathogen detection in liquid matrix. Thirty milliliters of each water sample were homogenized by vortexing at 4°C. Then, 15 mL of the vortexed samples were transferred to the Amicon Ultra-15 Centrifugal Filter Unit (Amicon) to be concentrated by centrifugation at 3234 g for 35 min at 4°C. Finally, their nucleic acids were extracted with IndiMag Pathogen Kit (Indical Bioscience) in a final volume of 100 μL. The reverse transcription-dPCR program and reaction mixtures were identical to those described in Viveros et al. (2022). PMMoV was detected via gene amplification, using the following set of primers and probe, respectively: PMMoV_F-GAGTTTGACCTTAACGTTTGA, PMMoV_ R-TTGTCGGTTGCAATGCAAGT, and PMMoV_P-CCTACCGAAGCAAATG, adapted from Haramoto et al. (2013). To ensure homogenization, dPCR reaction mixtures were prepared in a standard PCR plate as follows: each well contained one reaction with 10 μL of 4× One-Step Viral RT-PCR Master Mix, 5 μL of the primers/probes mix (2.25 μM of both primers and 0.625 μM of probe), 4 μL of DNA extract, and nuclease-free water up to the final volume of 40 μL. Each dPCR reaction was transferred to one well of a QIAcuity Nanoplate 26 K 24-well and inserted into the QIAcuity instrument (Qiagen, Germany). After a priming and rolling step in order to generate and isolate the 26,000 chamber partitions, the reverse transcription and amplification occurred under the following cycling conditions: 50°C for 40 min for reverse transcription, 95°C for 2 min for enzyme activation, and 40 two-step cycles: 95°C for 5 s for denaturation and 58°C for 60 s for annealing/extension. Finally, the plate imaging step was performed. Some raw results corresponding to the inventory of positive and negative partitions are shown in Figure S1 in Supplementary Material. Positive (of dPCR) and negative (of extraction and dPCR) controls were included in each run. PMMoV concentrations, deduced from Poisson statistics, were expressed in genomic units per L (GU.L−1). The limit of detection was 10 copies per dPCR reaction, the limit of quantification was 100 copies per dPCR reaction, and the limit of blank was 0. Data were analyzed using the QIAcuity Software suite v3.1.0.0.
2.4 Modeling parameters
Modeling was carried out on the segment of the Seine River between Choisy (starting point, 0 km) and Triel. Measuring 93.44 km, this segment includes two tributaries of the Seine River: the Marne River (5.86 km) and the Oise River (82.83 km), which were considered (Fig. 1) as potential virus inputs from their catchment areas. As no PMMoV concentration measurements were available for either the Marne or the Oise Rivers during the studied period (2021–2024), we assumed that they were equivalent to those measured at Choisy, with the same flow rate for the Oise River as for the Marne River. The viral concentrations measured in sewage water at Clichy (28.87 km) were used as average levels in Paris's sewage water, enabling us to model an input of viruses from this river’s section.
A non-constant velocity transport model using partial differential equations was used. The dynamical model describing virus concentration is a simplified model based on classical physical assumptions. It is intended to simulate an approximate virus concentration given initial measurements, water velocity, and an extinction coefficient. Model trajectories are validated empirically by assessing their agreement with the available measurements. We denote v(t) as the speed of the river current deduced from the flow rate at Austerlitz, c as the concentration of virus, and α as the extinction rate. This equation:
 (1)
(1)
describes how virus concentration evolves in time (t in [0, T]) and space (x in [0, L]) under the combined effect of advection (transport by water in dimension 1) and natural virus extinction (the right-hand side of the equation). As obligatory parasites, viruses cannot multiply without their host (Solanaceae species in the case of PMMoV (Ochar et al., 2023), i.e., from the moment they reach the surface of the Seine River. The extinction rate as a constant (α) was obtained from in situ measurements of Ahmed et al. (2024) in two temperate estuarine waters: 0.088 per day for PMMoV. This means that the time to achieve one log reduction (T90) of PMMoV is 25 days.
The one-dimensional equation (1) is completed by boundary conditions and an initial condition obtained from measurements at Choisy. The value of concentration at Choisy for each time t is obtained by interpolation of monthly measurements. It is a rough approximation because many other variations can occur during a month. However, this allows an estimation of the order of magnitude of concentrations for times close to the measurement times and allows testing of hypotheses. As in this initial study, spatial variations in velocity are neglected in favor of temporal variations, an analytical solution to equation (1) is used to simulate virus dynamics (see Supplementary Material for the form of this solution). The studied Seine River part was divided into four sections to take into account the contributions of tributaries and sewage water (see the four sections represented in different colors on the map in Fig. 1).
3 Results and discussion
3.1 Measured viral concentration
PMMoV was detected in high concentrations, upstream and downstream of the Seine River (Fig. 2). At Choisy, PMMoV concentrations ranged from a minimum of 8.2 × 10⁴ GU L−1 in July 2024 to a maximum of 4.7 × 10⁶ GU L−1 in April 2022. At Triel, concentrations ranged from 1.3 × 10⁵ GU L−1 in July 2021 to 3.2 × 10⁷ GU L−1 in December 2022. These values are consistent with those reported in rivers, where they are typically found in the range of 103 to 106 GU L−1 (Kitajima et al., 2018).
Our results showed concentrations were consistently higher downstream of Paris than upstream. Moreover, concentrations in sewage water far exceeded those in rivers. They ranged from 8.86 × 10⁶ GU L−1− in March 2024 to 6.95 × 10⁸ GU L in November 2021. It should be noted that the PMMoV concentrations observed in Paris sewage waters corresponded to values observed in WWTP inlet: Kitajima et al. (2018) reported concentrations above 105 GU L−1−. As a sewage-associated virus, its persistence in the aquatic environment and its constant high concentration predispose it to be a potential bioindicator of the Seine River quality (Rosario et al., 2009; Choi et al., 2025).
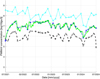 |
Fig. 2 Temporal variations of PMMoV concentrations, measured upstream of Paris (Choisy-le-Roi, black diamonds), downstream of Paris (Triel-sur Seine, dark blue squares), in sewage water at Clichy (light blue triangles) and simulated concentrations at Triel-sur-Seine (green curve) considering virus inputs from both tributaries and sewage water in addition to viral extinction (Hypothesis 3). |
3.2 Modeling viral dynamics
Given the high occurrence and concentration of PMMoV in the Seine River, we attempted to explain the variations in concentrations of this non-human pathogenic virus between upstream and downstream of Paris. Different hypotheses (Hypotheses 1–3) were successively tested to explain the variation of virus concentration.
Hypothesis 1: The decay rate of the virus explains the observed concentrations
In the first stage, only the virus extinction phenomenon (via its decay rate) was considered in the model, assuming the same virus concentration in tributaries (Marne and Oise Rivers) as in the Seine River at Choisy. As a result, the modeled concentrations downstream (green curve, Fig. S2A) were of the same order of magnitude as those observed upstream (Choisy, black dotted line), i.e., 10 times lower than those expected (blue dotted line): the root mean square error (RMSE) on log10(GU L−1) values was 1.104. This first simulation did not explain the higher concentrations observed downstream compared with upstream. This discrepancy suggested a supply of virus taking place between the two sites, Choisy and Triel, compensating for the expected viral extinction. The sources of viral contamination of the natural environment can be numerous, particularly when the environment is highly anthropized, as in the Paris area. As observed in other rivers than the Seine River, it can originate from either point sources such as wastewater seepage, wastewater discharges treated by wastewater treatment plants where it is not completely eliminated, or diffuse sources such as runoff from urban or agricultural areas, or remobilization of river sediments during heavy rainfall (Harwood et al., 2014).
Hypothesis 2: A tributary is the main contributor (in addition to viral decay rate)
In the second stage, we successively determined the virus concentration required in one of the two tributaries (Marne or Oise Rivers) to explain the observed increase between upstream and downstream, assuming the same virus concentration in the other tributary as in the Seine River at Choisy. PMMoV concentrations in each of these tributaries were separately computed to fit data at Triel. These simulation results were considered implausible because they yielded tributary concentrations of the same order as those observed in sewage water, even sometimes exceeding them (Figs. S2B and S2C: magenta curves with average concentration of 8.8 × 10⁷ GU L−1− for Marne River and 5.6 × 10⁷ GU L−1 for Oise River). Assuming that the flow rate is the same for each tributary, distributing the required virus concentration between the two tributaries would simply halve the required concentration, leading to the same conclusion.
Hypothesis 3: An input of sewage water is the main contributor
Finally, since virus measurements were also conducted in sewage water at Clichy, we used them to assess a viral contamination value from sewage. In case an input from sewage at this concentration was present in the Seine River, the model determined correctly the required flow rate of this input in order to fit the simulation with the observation downstream of Paris (at Triel). Note that the two tributaries are assumed to have the same virus concentration as the Seine River at Choisy. The determined flow rate represents all the inputs of sewage water on the studied part of the Seine River. PMMoV concentrations measured at Triel could be explained if the sewage input has a variable flow rate with an average of 54.14 m3 s−1 (green curve, Fig. 2): the RMSE on log10 (GU L−1−) values was 0.096. Furthermore, this flow rate is of the same order of magnitude as the mean discharge rate of a wastewater treatment plant such as Seine Aval (SAV), which is 19.7 m3.s−1 (Viveros et al., 2022). This latter hypothesis appears to be the best to date.
The developed model enabled the description of the dynamics of PMMoV in the Seine River between upstream and downstream of Paris. A preliminary hypothesis to explain the increase in sewage-associated viruses between upstream and downstream environments is the potential impact of WWTP discharges. Pascual-Benito et al. (2020) observed an increase of 1–2 log10 in the concentration of bioindicators (somatic coliphages, GA17 bacteriophages) in an intermittent Mediterranean stream following the outflow of a WWTP. In addition to robust urbanization and rising anthropogenic pressure, the effluent of the WWTP appeared to exert a considerable influence on the increasing virus concentration along the river.
While PMMoV was selected as a relevant molecular marker of human fecal contamination, other viral indicators could also be considered within a similar modeling framework. Specifically, F-specific RNA bacteriophages, somatic coliphages, or CrAssphage have been extensively utilized as indicators of fecal pollution and viral contamination in water environments (Farkas et al., 2020). Somatic coliphages have been proposed for inclusion in European regulations, including the EU Directive on water intended for human consumption. The incorporation of these indicators could facilitate a comparison between molecular and infectivity-based metrics of fecal contamination.
This study utilized molecular biology tools exclusively for the quantification of viral genomes. Research has shown that viral genome persistence in aquatic environments often exceeds viral infectivity. This leads to an overestimation of the presence of infectious particles when using molecular methods alone (Ogorzaly et al., 2010; Gerba et al., 2017). Consequently, the model focuses on the transport and decay of viral genomes rather than on infectious viruses. While genome-based indicators remain highly relevant for tracking sources and dynamics of fecal contamination, they may not directly reflect microbiological risk. Future work combining molecular detection with infectivity assays could help refine extinction parameters and improve the interpretation of modeling outputs in terms of water quality and health relevance.
This work is a preliminary case study focusing on a highly anthropized river. However, the dynamical model is based on classical physical assumptions for fluid flows. Provided with the appropriate hydrological data in particular flow velocity, the model could be applied to other rivers.
4 Conclusion
This work is the first attempt to model spatial and temporal viral dynamics from sewage to the river of the Parisian section of the Seine River. Based on 3 years of monthly monitoring, we propose a simple model describing the fate of PMMoV, considered as a promising marker of sewage contamination.
The model explained the observed viral variations in concentrations of a sewage virus in the Seine River by the contributions of the two Seine River tributaries, which carried moderate viral loads, together with sewage waters showing a more substantial input of viruses. However, this probably did not reflect the real scenario of the sewage-associated virus inputs in this part of the Seine River. Other point or diffuse sources of sewage-associated virus should be considered.
Because the model required several extrapolations, its accuracy could be improved by increasing both measurement frequency and spatial coverage. In addition, viral decay was the only fate process considered. In reality, viruses may also undergo attachment–detachment from particles, entailing vertical transport, and thus adding another dimension to the model (Bhattarai et al., 2011). Other ecological interactions, such as predation or competition, could be integrated in future developments. Furthermore, we only considered genome persistence and not virulence, but the model is adaptable to any other viruses, sampling sites or types of data.
Acknowledgments
The fourth and fifth authors conducted this work within the France 2030 program, the Centre Henri Lebesgue ANR-11-LABX-0020-01.
Funding
This work was supported by CNRS AMIES (MatheO); SIAAP (MeSeine program).
Supplementary material
Figure S1. Scatterplot (raw results) from PMMoV dPCR analysis on the Qiacuity® platform. Blue dots represent positive partitions, where amplification occurred (the fluorescence intensity is high), while grey dots represent negative partitions. The red line indicates the threshold used to discriminate between positive and negative partitions. Final results are calculated based on the number of positive partitions detected by applying Poisson statistics. As no positive partitions could be detected either in the negative control of extraction or in the dPCR negative control, the space between positive and negative partitions of the environmental water sample was extremely clear (with no rain), showing the successful amplification of PMMoV target in the environmental water sample.
Figure S2. Temporal variations of PMMoV concentrations, measured upstream of Paris (Choisy-le-Roi, black diamonds), downstream of Paris (Triel-sur-Seine, dark blue squares), in sewage water at Clichy (light blue triangles), and different simulated concentrations (green curves) at Triel-sur-Seine: (A) Hypothesis 1, tributary concentration assumed to be equal to the one of Choisy; (B) Hypothesis 2, with Marne River; and (C) Hypothesis 2, with Oise River. Pink curves in panels (B) and (C) corresponded to the simulated concentrations in the tributaries in case of an input of this tributary, allowing it to fit with the observed measurements at Triel. The pink dashed line represented the mean estimated concentrations in the tributary.
Access Supplementary MaterialReferences
- Ahmed W, Korajkic A, Gabrewold M, Payyappat S, Cassidy M, Harrison N, Besley C. 2024. Assessing the nucleic acid decay of human wastewater markers and enteric viruses in estuarine waters in Sydney, Australia. Sci Total Environ 926: 171389. [Google Scholar]
- Andrianjakarivony FH, Bettarel Y, Desnues C. 2023. Searching for a reliable viral indicator of fecal pollution in aquatic environments. J Microbiol. 61: 589–602. [Google Scholar]
- Bhattarai R, Kalita P, Trask J, Kuhlenschmidt MS. 2011. Development of a physically-based model for transport of Cryptosporidium parvum in overland flow. Environ Modell Softw 26: 1289–1297. [Google Scholar]
- Choi HSH, Coppin JD, Brackens E, Mayo L, Hwang M, Bennett M, Chatterjee P, Gamage SD, Jinadatha C. 2025. Utilities of PMMoV as an internal control for the building-level wastewater surveillance of SARS-CoV-2. Microbiol Spectr 13: e0141825. [Google Scholar]
- Farkas K, Walker DI, Adriaenssens EM, McDonald JE, Hillary LS, Malham SK, Jones DL. 2020. Viral indicators for tracking domestic wastewater contamination in the aquatic environment. Water Res 181: 115926. [Google Scholar]
- Farrell ML, Joyce A, Duane S, Fitzhenry K, Hooban B, Burke LP, Morris D. 2021. Evaluating the potential for exposure to organisms of public health concern in naturally occurring bathing waters in Europe: a scoping review. Water Res 206: 117711. [Google Scholar]
- Gerba C, Betancourt W, Kitajima M. 2017. How much reduction of virus is needed for recycled water: A continuous changing need for assessment? Water Res 108: 2531. [Google Scholar]
- Guérin-Rechdaoui S, Bize A, Levesque-Ninio C, Janvier A, Lacroix C, Le Brizoual F, Barbier J, Amsaleg CR, Azimi S, Rocher V. 2022. Fate of SARS-CoV-2 coronavirus in wastewater treatment sludge during storage and thermophilic anaerobic digestion. Environ Res 214: 114057. [Google Scholar]
- Haramoto E, Kitajima M, Kishida N, Konno Y, Katayama H, Asami M, Akiba M. 2013. Occurrence of pepper mild mottle virus in drinking water sources in Japan. Appl Environ Microbiol 79: 7413–7418. [Google Scholar]
- Harwood VJ, Staley C, Badgley BD, Borges K, Korajkic A. 2014. Microbial source tracking markers for detection of fecal contamination in environmental waters: relationships between pathogens and human health outcomes. FEMS Microbiol Rev 38: 1–40. [Google Scholar]
- Kitajima M, Sassi HP, Torrey JR. 2018. Pepper mild mottle virus as a water quality indicator. npj Clean Water 1: 19. [Google Scholar]
- Mitchell J, Akram S. 2017. Pathogen specific persistence modeling data, in Water and Sanitation for the 21st Century: Health and Microbiological Aspects of Excreta and Wastewater Management (Global Water Pathogen Project). Michigan State University. [Google Scholar]
- Ochar K, Ko H-C, Woo H-J, Hahn B-S, Hur O. 2023. Pepper mild mottle virus: an infectious pathogen in pepper production and a potential indicator of domestic water quality. Viruses 15: 282. [Google Scholar]
- Ogorzaly L, Bertrand I, Paris M, Maul A, Gantzer C. 2010. Occurrence, survival, and persistence of human adenoviruses and F-specific RNA phages in raw groundwater. Appl Environ Microbiol 76: 8019–8025. [Google Scholar]
- Pascual-Benito M, Nadal-Sala D, Tobella M, Ballesté E, García-Aljaro C, Sabaté S, Sabater F, Martí E, Gracia CA, Blanch AR, Lucena F. 2020. Modelling the seasonal impacts of a wastewater treatment plant on water quality in a Mediterranean stream using microbial indicators. J Environ Manage 261: 110220. [Google Scholar]
- Peduzzi P. 2016. Virus ecology of fluvial systems: a blank spot on the map? Biol Rev 91: 937–949. [Google Scholar]
- Prevost B, Lucas FS, Goncalves A, Richard F, Moulin L, Wurtzer S. 2015. Large scale survey of enteric viruses in river and waste water underlines the health status of the local population. Environ Int 79: 42–50. [Google Scholar]
- Rosario K, Symonds EM, Sinigalliano CD, Stewart JR, Breitbart M. 2009. Pepper mild mottle virus as an indicator of fecal pollution. Appl Environ Microbiol 75: 7261–7267. [Google Scholar]
- Vasickova P, Kovarcik K. 2013. Natural persistence of food- and waterborne viruses, in Viruses in Food and Water, Elsevier, pp. 179–204. [Google Scholar]
- Viveros ML, Azimi S, Pichon E, Roose-Amsaleg C, Bize A, Durandet F, Rocher V. 2022. Wild type and variants of SARS-COV-2 in Parisian sewage: presence in raw water and through processes in wastewater treatment plants. Environ Sci Pollut Res 29: 67442–67449. [Google Scholar]
- Wurtzer S, Marechal V, Mouchel J, Maday Y, Teyssou R, Richard E, Almayrac J, Moulin L. 2020. Evaluation of lockdown effect on SARS-CoV-2 dynamics through viral genome quantification in waste water, Greater Paris, France, 5 March to 23 April 2020. Eurosurveillance 25: 2000776. [Google Scholar]
- Zhang T, Breitbart M, Lee WH, Run J-Q, Wei CL, Soh SWL, Hibberd ML, Liu ET, Rohwer F, Ruan Y. 2006. RNA viral community in human feces: prevalence of plant pathogenic viruses. PLoS Biol 4: e3. [Google Scholar]
Cite this article as: Langlais A, Ramseyer L, Quaiser A, Mahé F, Monbet V, Marconi A, Mougin J, Guérin-Rechdaoui S, Roose-Amsaleg C. 2026. Modeling the dynamics of PMMoV, a sewage-associated virus in the Seine River across Paris. Int. J. Lim. 62: 8. https://doi.org/10.1051/limn/2026006
All Figures
|
Fig. 1 Map of the Seine River in the studied Paris region, including the three virus measurement sites (Choisy-le-Roi, Triel-sur-Seine for river freshwater, and Clichy for sewage water; white circles) and the corresponding river flow stations (Alfortville, Poissy, and Austerlitz; black triangles). The Seine River in the studied region is segmented into four parts by black lines, corresponding to the four studied sections (highlighted), taking into account the two tributaries (Marne and Oise rivers) and the stormwater overflow structure at Clichy. The six wastewater treatment plants are represented: Seine Valenton (SEV), Marne Aval (MAV), Seine Morée (SEM), Seine Centre (SEC), Seine Aval (SAV), and Seine Grésillons (SEG). |
| In the text | |
|
Fig. 2 Temporal variations of PMMoV concentrations, measured upstream of Paris (Choisy-le-Roi, black diamonds), downstream of Paris (Triel-sur Seine, dark blue squares), in sewage water at Clichy (light blue triangles) and simulated concentrations at Triel-sur-Seine (green curve) considering virus inputs from both tributaries and sewage water in addition to viral extinction (Hypothesis 3). |
| In the text | |
Current usage metrics show cumulative count of Article Views (full-text article views including HTML views, PDF and ePub downloads, according to the available data) and Abstracts Views on Vision4Press platform.
Data correspond to usage on the plateform after 2015. The current usage metrics is available 48-96 hours after online publication and is updated daily on week days.
Initial download of the metrics may take a while.